UNITED STATES
SECURITIES AND EXCHANGE COMMISSION
Washington, D.C. 20549
FORM 10-K
(Mark One)
|
☒ |
ANNUAL REPORT PURSUANT TO SECTION 13 OR 15(d) OF THE SECURITIES EXCHANGE ACT OF 1934 |
For the Fiscal Year Ended December 31, 2018
OR
|
☐ |
TRANSITION REPORT PURSUANT TO SECTION 13 OR 15(d) OF THE SECURITIES EXCHANGE ACT OF 1934 |
For the Transition Period From to
Commission file number: 001-36309
INOGEN, INC.
(Exact name of registrant as specified in its charter)
|
Delaware |
|
33-0989359 |
|
(State or other jurisdiction of incorporation or organization) |
|
(I.R.S. Employer Identification No.) |
|
326 Bollay Drive Goleta, California |
|
93117 |
|
(Address of principal executive offices) |
|
(Zip Code) |
(805) 562-0500
(Registrant’s telephone number, including area code)
Securities registered pursuant to Section 12(b) of the Act:
|
Title of each class |
|
Name of each exchange on which registered |
|
Common Stock, $0.001 par value |
|
The NASDAQ Stock Market LLC (NASDAQ Global Select Market) |
Securities registered pursuant to Section 12(g) of the Act: None
Indicate by check mark if the registrant is a well-known seasoned issuer, as defined in Rule 405 of the Securities Act. Yes ☒ No ☐
Indicate by check mark if the registrant is not required to file reports pursuant to Section 13 or Section 15(d) of the Act. Yes ☐ No ☒
Indicate by check mark whether the Registrant (1) has filed all reports required to be filed by Section 13 or 15(d) of the Securities Exchange Act of 1934 during the preceding 12 months (or for such shorter period that the Registrant was required to file such reports), and (2) has been subject to such filing requirements for the past 90 days. Yes ☒ No ☐
Indicate by check mark whether the registrant has submitted electronically every Interactive Data File required to be submitted pursuant to Rule 405 of Regulation S-T (§232.405 of this chapter) during the preceding 12 months (or for such shorter period that the registrant was required to submit such files). Yes ☒ No ☐
Indicate by check mark if disclosure of delinquent filers pursuant to Item 405 of Regulation S-K (§229.405 of this chapter) is not contained herein, and will not be contained, to the best of the Registrant’s knowledge, in definitive proxy or information statements incorporated by reference in Part III of this Form 10-K or any amendment to this Form 10-K. ☒
Indicate by check mark whether the registrant is a large accelerated filer, an accelerated filer, a non-accelerated filer, smaller reporting company, or an emerging growth company. See the definitions of “large accelerated filer,” “accelerated filer,” “smaller reporting company,” and “emerging growth company” in Rule 12b-2 of the Exchange Act.
|
Large accelerated filer |
|
☒ |
|
Accelerated filer |
|
☐ |
|
|
|
|
|
|||
|
Non-accelerated filer |
|
☐ |
|
Smaller reporting company |
|
☐ |
|
Emerging growth company |
|
☐ |
|
|
|
|
If an emerging growth company, indicate by check mark if the registrant has elected not to use the extended transition period for complying with any new or revised financial accounting standards provided pursuant to Section 13(a) of the Exchange Act.
Indicate by check mark whether the registrant is a shell company (as defined in Rule 12b-2 of the Exchange Act). Yes ☐ No ☒
The aggregate market value of the voting and non-voting stock held by non-affiliates of the Registrant, based on the closing sale price of the Registrant’s common stock on the last business day of its most recently completed second fiscal quarter, as reported on The NASDAQ Global Select Market, was approximately $1.2 billion. Shares of common stock held by each executive officer and director and by each other person who may be deemed to be an affiliate of the Registrant, have been excluded from this computation. The determination of affiliate status for this purpose is not necessarily a conclusive determination for other purposes.
As of February 22, 2019, the Registrant had 21,814,895 shares of common stock, par value $0.001, outstanding.
DOCUMENTS INCORPORATED BY REFERENCE
Portions of the Registrant’s definitive Proxy Statement to be filed with the Securities and Exchange Commission in connection with the Registrant’s 2019 Annual Meeting of Stockholders, which will be filed subsequent to the date hereof, are incorporated by reference into Part III of this Form 10-K. Such Proxy Statement will be filed with the Securities and Exchange Commission not later than 120 days following the end of the Registrant’s fiscal year ended December 31, 2018.
|
|
|
|
|
Page |
|
Part I |
|
|
||
|
Item 1. |
|
|
2 |
|
|
Item 1A. |
|
|
22 |
|
|
Item 1B. |
|
|
52 |
|
|
Item 2. |
|
|
52 |
|
|
Item 3. |
|
|
53 |
|
|
Item 4. |
|
|
53 |
|
|
|
|
|
|
|
|
Part II |
|
|
||
|
Item 5. |
|
|
54 |
|
|
Item 6. |
|
|
56 |
|
|
Item 7. |
|
Management’s Discussion and Analysis of Financial Condition and Results of Operations |
|
58 |
|
Item 7A. |
|
|
82 |
|
|
Item 8. |
|
|
82 |
|
|
Item 9. |
|
Changes in and Disagreements with Accountants on Accounting and Financial Disclosure |
|
83 |
|
Item 9A. |
|
|
83 |
|
|
Item 9B. |
|
|
85 |
|
|
|
|
|
||
|
Part III |
|
|
||
|
Item 10. |
|
|
86 |
|
|
Item 11. |
|
|
86 |
|
|
Item 12. |
|
Security Ownership of Certain Beneficial Owners and Management and Related Stockholder Matters |
|
86 |
|
Item 13. |
|
Certain Relationships and Related Transactions, and Director Independence |
|
86 |
|
Item 14. |
|
|
86 |
|
|
|
|
|
||
|
Part IV |
|
|
||
|
Item 15. |
|
|
87 |
|
i
PART I
Forward-Looking Statements
This Annual Report on Form 10-K contains forward-looking statements within the meaning of Section 27A of the Securities Act of 1933, as amended, or the Securities Act, and Section 21E of the Securities Exchange Act of 1934, as amended, or the Exchange Act, that are based on our management’s beliefs and assumptions and on information currently available to our management. The forward-looking statements are contained principally in the sections entitled “Business,” “Risk Factors,” and “Management’s Discussion and Analysis of Financial Condition and Results of Operations.” Forward-looking statements include, but are not limited to, statements concerning the following:
|
|
• |
information concerning our possible or assumed future cash flow, revenue, sources of revenue and results of operations, operating and other expenses; |
|
|
• |
our assessment of reduced reimbursement rates, future rounds of competitive bidding, and future changes in rental revenue; |
|
|
• |
our expectations regarding regulatory approvals and government and third-party payor coverage and reimbursement; |
|
|
• |
our ability to develop new products, improve our existing products and increase the value of our products; |
|
|
• |
our expectations regarding Inogen Capital; |
|
|
• |
our expectations regarding the timing of new products and product improvement launches, as well as product features and specifications; |
|
|
• |
market share expectations, unit sales, business strategies, financing plans, expansion of our business, competitive position, industry environment, and potential growth opportunities; |
|
|
• |
our expectations regarding the market size, market growth and the growth potential for our business; |
|
|
• |
our ability to sustain and manage growth, including our ability to develop new products and enter new markets; |
|
|
• |
our expectations regarding the average selling price and manufacturing costs of our products, including our expectations to continue to reduce average unit costs for our systems; |
|
|
• |
our expectation to expand our sales and marketing channels, including through hiring additional sales representatives and expanding our advertising campaigns; |
|
|
• |
our expectations with respect to our European and U.S. facilities and our expectations with respect to our contract manufacturer in Europe; |
|
|
• |
our ability to successfully acquire and integrate companies and assets; |
|
|
• |
our expectations regarding the impact and implementation of trade regulations on our supply chain; |
|
|
• |
our expectations regarding excess tax benefits from stock-based compensation; |
|
|
• |
our expectations of future accounting pronouncements or changes in our accounting policies; |
|
|
• |
our assessments and estimates of our effective tax rate; |
|
|
• |
our internal control environment; |
|
|
• |
the effects of seasonal trends on our results of operations and estimated hiring plans; |
|
|
• |
our expectation that our existing capital resources and the cash to be generated from expected product sales and rentals will be sufficient to meet our projected operating and investing requirements for at least the next twelve months; and |
|
|
• |
the effects of competition. |
Forward-looking statements include statements that are not historical facts and can be identified by terms such as “anticipates,” “believes,” “could,” “seeks,” “estimates,” “expects,” “intends,” “may,” “plans,” “potential,” “predicts,” “projects,” “should,” “will,” “would,” or similar expressions and the negatives of those terms.
1
Forward-looking statements involve known and unknown risks, uncertainties, and other factors that may cause our actual results, performance, or achievements to be materially different from any future results, performance, or achievements expressed or implied by the forward-looking statements. We discuss these risks in greater detail in Part I, Item 1A, “Risk Factors,” and elsewhere in this Annual Report on Form 10-K. Given these uncertainties, you should not place undue reliance on these forward-looking statements. Moreover, we operate in a very competitive and rapidly changing environment. New risks emerge from time to time. It is not possible for us to predict all risks, nor can we assess the impact of all factors on our business or the extent to which any factor, or combination of factors, may cause actual results to differ materially from those contained in any forward-looking statements we may make. In light of these risks, uncertainties and assumptions, the future events and trends discussed in this Annual Report on Form 10-K may not occur and actual results could differ materially and adversely from those anticipated or implied in the forward-looking statements.
The forward-looking statements made in this Annual Report on Form 10-K relate only to events as of the date on which the statements are made. Except as required by law, we assume no obligation to update these forward-looking statements, or to update the reasons actual results could differ materially from those anticipated in these forward-looking statements, even if new information becomes available in the future.
This Annual Report on Form 10-K also contains estimates, projections and other information concerning our industry, our business, and the markets for certain diseases, including data regarding the estimated size of those markets, and the incidence and prevalence of certain medical conditions. Information that is based on estimates, forecasts, projections, market research or similar methodologies is inherently subject to uncertainties and actual events or circumstances may differ materially from events and circumstances reflected in this information. Unless otherwise expressly stated, we obtained this industry, business, market and other data from reports, research surveys, studies and similar data prepared by market research firms and other third parties, industry, medical and general publications, government data and similar sources.
“Inogen,” “Inogen One,” “Inogen One G2,” “Inogen One G3,” “G4,” “G5,” “Oxygenation,” “Live Life in Moments, not Minutes,” “Never Run Out of Oxygen,” “Oxygen Therapy on Your Terms,” “Oxygen.Anytime.Anywhere,” “Reclaim Your Independence,” “Intelligent Delivery Technology,” “Inogen At Home,” and the Inogen design are registered and/or pending trademarks with the United States Patent and Trademark Office of Inogen, Inc. We own trademark registrations for the mark “Inogen” in Australia, Canada, South Korea, Mexico, Europe (European Union Registration), and Japan. We own pending applications for the mark “Inogen” in Argentina, Brazil, China, and Ecuador, and an International Registration for the mark “Inogen” designating Colombia, Iceland, India, Israel, New Zealand, Norway, Singapore, Switzerland and Turkey. We own a trademark registration for the mark “イノジェン” in Japan. We own trademark applications for the marks “印诺真” and “艾诺根” in China. We own trademark registrations for the mark “Inogen One” in Australia, Canada, China, South Korea, Mexico, and Europe (European Union Registration). We own a trademark registration for the mark “Satellite Conserver” in Canada. We own a trademark registration for the mark “Inogen At Home” in Europe (European Union Registration). We own trademark registrations for the mark “G4” in Europe (European Union Registration) and the United Kingdom. We own trademark applications for the Inogen design in Bolivia and China. Other service marks, trademarks, and trade names referred to in this Annual Report on Form 10-K are the property of their respective owners.
In this Annual Report on Form 10-K, “we,” “us” and “our” refer to Inogen, Inc. and its subsidiaries.
General
We were incorporated in Delaware on November 27, 2001. We are a medical technology company that primarily develops, manufactures and markets innovative portable oxygen concentrators used to deliver supplemental long-term oxygen therapy to patients suffering from chronic respiratory conditions. Traditionally, these patients have relied on stationary oxygen concentrator systems for use in the home and oxygen tanks or cylinders for mobile use, which we call the delivery model. The tanks and cylinders must be delivered regularly and have a finite amount of oxygen, which requires patients to plan activities outside of their homes around delivery schedules and a finite oxygen supply. Additionally, patients must attach long, cumbersome tubing to their stationary concentrators simply to enable mobility within their homes. Our proprietary Inogen One® systems concentrate the air around the patient to offer a single source of supplemental oxygen anytime, anywhere with a portable device weighing as little as approximately 2.8 pounds with a single battery. Our Inogen One systems range from 2.6 to 4.7 hours of battery life with a single battery and can be plugged into an outlet when at home, in a car, or in a public place with outlets available. Our Inogen One systems reduce the patient’s reliance on stationary concentrators and scheduled deliveries of tanks with a finite supply of oxygen, thereby improving patient quality of life and fostering mobility.
2
Portable oxygen concentrators represented the fastest-growing segment of the Medicare oxygen therapy market between 2012 and 2017. Based on 2017 Medicare data, we estimate the number of patients using portable oxygen concentrators represents approximately 10.8% of the total addressable oxygen market in the United States, although the Medicare data does not account for private insurance, Medicare Advantage, Medicaid and cash-pay patients in the market. Based on 2016 industry data, we believe we were the leading worldwide manufacturer of portable oxygen concentrators. We believe we were the first oxygen therapy manufacturer to employ a direct-to-consumer marketing strategy, meaning we advertise directly to patients, process their physician paperwork, and provide clinical support as needed. While other manufacturers have also begun direct-to-consumer marketing campaigns to drive patient sales, we believe we are the only manufacturer of portable oxygen concentrators that employs a direct-to-consumer rental strategy in the United States, meaning we bill Medicare or insurance on their behalf. To pursue a direct-to-consumer rental strategy, our manufacturing competitors would need to meet national accreditation and state-by-state licensing requirements and secure Medicare billing privileges, as well as compete with the home medical equipment providers who many of our manufacturing competitors sell to across their entire homecare business.
Since adopting our direct-to-consumer rental strategy in 2009, we have directly sold or rented more than 567,000 of our Inogen oxygen concentrators as of December 31, 2018.
We incorporated Inogen Europe Holding B.V., a Dutch limited liability company, on April 13, 2017. We own all outstanding stock of Inogen Europe Holding B.V., which became a wholly owned subsidiary of Inogen. On May 4, 2017, Inogen Europe Holding B.V. acquired all issued and outstanding capital stock of MedSupport Systems B.V. (MedSupport) and began operating under the name Inogen Europe B.V.
The Company merged Inogen Europe Holding B.V. and Inogen Europe B.V. on December 28, 2018.
Our market
We estimate approximately 3 million patients in the United States used long-term oxygen therapy in 2017 based on 2017 Medicare data and our estimate of the size of the Medicare market relative to the total market. Long-term oxygen therapy is defined as the provision of oxygen therapy for use at home in patients who have chronic low blood oxygen levels (hypoxemia). Based on our patient population, we estimate approximately 60% of U.S. long-term oxygen therapy insurance patients are covered by Medicare, and 40% of U.S. oxygen therapy insurance patients are covered by Medicare Advantage and other private insurance plans. While there is no up-to-date single source of long-term oxygen therapy market data, based on market data from various industry sources and our own internal data, we believe that growth in the number of oxygen therapy patients in the United States was low single digits in 2017, and we now expect that trend to continue for the next few years. However, we believe that reduced reimbursement rates in connection with competitive bidding, enhanced Medicare billing requirements, and the conversion from tank deliveries to portable oxygen concentrators (POCs) will help contribute to growth opportunities for POCs that exceed the long-term oxygen therapy market growth rate. Since utilization of long-term oxygen therapy is strongly linked to developed nations with established government reimbursement, western Europe represents our second largest market today behind the United States.
Long-term oxygen therapy has been shown to be a cost-efficient and clinically effective means to treat hypoxemia, a condition in which patients have insufficient oxygen in the blood. Hypoxemic patients are unable to convert oxygen found in the air into the bloodstream in an efficient manner, causing organ damage and poor health. Chronic obstructive pulmonary disease, or COPD, is a leading cause of hypoxemia. Between 65% to 70% of our patient population has been diagnosed with COPD, and as COPD progresses, patients may need long-term oxygen therapy as part of their treatment. Industry sources estimate that approximately 15 million people in the United States have been diagnosed with COPD, with millions more who are unaware they have COPD. COPD is the third leading cause of death in the United States and one of the leading causes of death globally. There are an estimated 210 million individuals worldwide who have COPD, with an estimated 100 million individuals located in China.
According to our analysis of 2017 Medicare data, approximately 73% of U.S. long-term oxygen therapy users utilized ambulatory oxygen and the remaining 27% were considered stationary, and either required oxygen twenty-four hours a day, seven days a week, or 24/7, but were not ambulatory, or did not require oxygen 24/7 and only needed nocturnal oxygen. Clinical data has shown that ambulatory patients who use oxygen therapy 24/7, regardless of modality, have approximately two times the survival rate and spend at least 60% fewer days annually in the hospital than non-ambulatory 24/7 oxygen therapy patients. The cost of one year of long-term oxygen therapy is less than the cost of one day in the hospital.
Based on 2017 Medicare data, we estimate that approximately 85% of the ambulatory patients rely upon the delivery model, which has the following disadvantages:
|
|
• |
limited flexibility outside the home, dictated by the finite oxygen supply provided by tanks and cylinders and dependence on delivery schedules; |
3
|
|
• |
restricted mobility and inconvenience within the home, as patients must attach long, cumbersome tubing to a noisy stationary concentrator to move within their homes; |
|
|
• |
products are not cleared for use on commercial aircraft and cannot plug into a vehicle outlet for extended use; and |
|
|
• |
high costs driven by the infrastructure necessary to establish a geographically diverse distribution network to serve patients locally, as well as personnel, fuel and other costs, which have limited economies of scale and generally increase over time. |
Portable oxygen concentrators were developed in response to many of the limitations associated with traditional oxygen therapy. Portable oxygen concentrators are designed to offer a self-replenishing, unlimited supply of oxygen that is concentrated from the surrounding air and to operate without the need for oxygen tanks or regular oxygen deliveries, enhancing patient freedom and independence. Additionally, because portable oxygen concentrators do not require the physical infrastructure and service intensity of the delivery model, we believe portable oxygen concentrators can provide long-term oxygen therapy with a lower cost structure. Despite the ability of portable oxygen concentrators to address many of the shortcomings of traditional long-term oxygen therapy, we estimate based on 2017 Medicare data that the total number of patients on portable oxygen concentrators represents approximately 10.8% of the total addressable long-term oxygen market in the United States, although the Medicare data does not account for private insurance, Medicare Advantage, Medicaid and cash-pay patients in the market. We believe the following have hindered the market acceptance of portable oxygen concentrators:
|
|
• |
to obtain portable oxygen concentrators, patients are dependent on home medical equipment providers, which have made significant investments in the physical distribution infrastructure to support the delivery model and which we believe are therefore disincentivized to encourage adoption of portable oxygen concentrators; |
|
|
• |
lack of patient and physician awareness of the existence and benefits of portable oxygen concentrators as an oxygen solution instead of the traditional delivery model; |
|
|
• |
constrained manufacturing costs of conventional portable oxygen concentrators, driven by home medical equipment provider preference for products that have lower upfront equipment cost; and |
|
|
• |
limitations of conventional portable oxygen concentrators, including bulkiness, poor reliability and lack of suitability beyond intermittent or travel use. |
Our solution
Our Inogen One systems provide patients who require long-term oxygen therapy with a reliable, lightweight single solution product that we believe improves quality-of-life, fosters mobility and eliminates dependence on both oxygen tanks and cylinders as well as stationary concentrators. We believe our direct-to-consumer marketing strategy increases our ability to effectively develop, design and market our Inogen One solutions, as it allows us to:
|
|
• |
drive patient awareness of our portable oxygen concentrators through direct marketing, thereby fueling our direct-to-consumer sales channel and creating pull through for our business-to-business channel. Other manufacturers mainly rely upon selling to homecare businesses, many of whom are incentivized to continue to service oxygen patients through the delivery model; |
|
|
• |
capture the manufacturer and home medical equipment provider margins on a portion of our revenue, allowing us to focus on the total cost of the solution and to invest in the development of product features instead of being constrained by the price required to attract representation from a distribution channel. For example, we have invested in features that improve patient satisfaction, product durability, reliability and longevity, which increase the cost of our hardware, but reduce the total cost of our solution by reducing our maintenance and repair cost; and |
|
|
• |
access and utilize direct patient feedback in our research and development efforts, allowing us to innovate based on this feedback and stay at the forefront of patient preference. For example, certain specifications of the Inogen One G4® and its accessories and the Inogen Connect platform were created based on direct patient feedback. |
4
We believe the combination of our direct-to-consumer marketing strategy with our singular focus on designing and developing oxygen concentrator technology has created a best-in-class portfolio of portable oxygen concentrators. Our two current portable product offerings, the Inogen One G4 and Inogen One G3®, at 2.8 and 4.8 pounds with a single battery, respectively, are among the lightest portable oxygen concentrators on the market and offer among the highest oxygen flow capacity per pound. We believe our Inogen One solutions offer the following benefits:
|
|
• |
Single solution for home, ambulatory, travel (including on commercial aircraft) and nocturnal treatment. We believe our Inogen One solutions are the only portable oxygen concentrators marketed as a single solution, by which we mean a patient can use our Inogen One systems as their only supplemental oxygen source with no need to also use a stationary concentrator regularly. Our compressors are specifically designed to enable our patients to run our portable oxygen concentrators 24/7, whether powered by battery or plugged into an outlet at home or in a car while the battery is recharging. |
|
|
• |
Reliability. We have prioritized product performance and reliability in each of our design projects and continuous improvement efforts. For example, beginning with the Inogen One G2, we have designed and manufactured our own compressors to ensure long life and high reliability. We have also continually improved compressor component designs and manufacturing processes throughout the product life cycle to capitalize on our integrated design and manufacturing team approach. Reliability is not only critical to patient satisfaction, but also to our cost management initiative, as our minimal physical infrastructure makes product exchanges more costly to us than providers with greater local physical infrastructure. |
|
|
• |
Effective for nocturnal use. Our Intelligent Delivery Technology® enables our portable oxygen concentrators to provide consistent levels of oxygen during sleep despite decreased respiratory rates. As a result, patients can rely on our Inogen One portable oxygen concentrators overnight while sleeping. |
|
|
• |
Unparalleled flow capacity. Our 2.8 pound Inogen One G4 has higher flow capacity than other sub-3 pound portable oxygen concentrators and our Inogen One G3 has higher flow capacity than other sub-5 pound portable oxygen concentrators. |
|
|
• |
User friendly features. Our systems are designed with multiple user-friendly features, including long battery life and low noise levels in their respective weight categories. |
Our Inogen One systems and Inogen At Home system
We market our current portable product offerings, the Inogen One G4 and the Inogen One G3, as single solutions for long-term oxygen therapy. This means our solutions can operate on a 24/7 basis for at least 60 months without a stationary concentrator, with minimal servicing of sieve beds, filters, and accessories. We believe the technology in our Inogen One systems is effective for nocturnal use. Our Inogen One portable oxygen concentrators can operate reliably and cost-effectively over the long period of time needed to service long-term oxygen therapy patients without supplemental use of a stationary concentrator or a replacement portable oxygen concentrator. The following table summarizes our key product features:
|
|
|
Key Product Specifications |
|
|||
|
|
|
Inogen One G4 |
|
Inogen One G3 |
|
|
|
Capacity (ml/min) |
|
630 |
|
|
1,050 |
|
|
Weight (lbs) |
|
2.8 (single battery) |
|
4.8 (single battery) |
|
|
|
|
|
3.3 (double battery) |
|
5.8 (double battery) |
|
|
|
Battery run-time |
|
Up to 2.6 hours (single battery) |
|
Up to 4.7 hours (single battery) |
|
|
|
|
|
Up to 5 hours (double battery) |
|
Up to 10 hours (double battery) |
|
|
|
Technology effective for overnight use |
|
Yes |
|
Yes |
|
|
|
Sound |
|
40 dBA |
|
39 dBA |
|
|
We have focused our research and development efforts on creating solutions that we believe have overcome the reputation of portable oxygen concentrators as being limited in durability and reliability as well as unsuitable for nighttime or 24/7 use. We specifically designed our compressors for 24/7 use.
5
All of our Inogen One systems are equipped with Intelligent Delivery Technology, a form of pulse-dose technology from which the patient receives a bolus of oxygen upon inhalation. Pulse-dose technology was developed to extend the number of hours an oxygen tank would last and is generally used on all ambulatory long-term oxygen therapy devices. Our proprietary conserver technology utilizes differentiated triggering sensitivity to quickly detect a breath and ensure oxygen delivery within the first 400 milliseconds of inspiration, the interval when oxygen has the most effect on lung gas exchange. During periods of sleep, respiratory rates typically decrease. Our Inogen One systems actively respond to this changing physiology through the use of proprietary technology that increases bolus size. Our Intelligent Delivery Technology is designed to provide effective levels of blood oxygen saturation during sleep and all other periods of rest and activity that are substantially equivalent to continuous flow systems. We have also launched Inogen Connect, a new wireless connectivity platform for the Inogen One G4 consisting of a front-end mobile application for use by long-term oxygen therapy users and a back-end database portal for use by homecare providers. The Inogen Connect app is compatible with Apple and Android platforms and includes patient features such as oxygen purity status, battery run time, product support functions, notification alerts, and remote software updates. We believe features of the back-end database portal such as remote troubleshooting, equipment health checks, and a location tracker will drive operational efficiencies for home oxygen providers and lower the total cost of servicing oxygen therapy patients.
The Inogen One G4, our latest portable oxygen concentrator released to market in May 2016, is among the lightest products on the market and has higher oxygen production capabilities than the other sub-3 pound portable oxygen concentrators on the market. We believe the performance parameters around our Inogen One systems allow us to serve approximately 90% of the ambulatory long-term oxygen patients based on our analysis of the patients who have contacted us and their clinical needs. Our products enable us to address a patient’s particular clinical needs, as well as lifestyle and performance preferences.
The Inogen At Home stationary oxygen concentrator allows us to access the non-ambulatory long-term oxygen therapy patient market and serves as a backup to our Inogen One system for ambulatory patients on our rental service. At approximately 18 pounds, we believe the Inogen At Home concentrator is the lightest five liter per minute continuous flow oxygen concentrator on the market today. Additionally, the Inogen At Home product has low power consumption with worldwide electrical compatibility, which should reduce the cost of electricity for oxygen therapy patients, as well as reduce manufacturing and distribution complexities. While the Inogen One product line is clinically validated for 24/7 use, the Inogen At Home product represents a compelling solution for stationary long-term oxygen therapy patients that do not require a portable solution, which are estimated to represent approximately 27% of total long-term oxygen therapy patients in the United States based on 2017 Medicare data.
Our direct-to-consumer business model has enabled us to receive direct patient feedback, and we have used this feedback to create portable oxygen concentrators that address the full suite of features and benefits critical to patient preference and retention. Our products prevent patients from having to choose between lightweight size, suitability for 24/7 use, reliability, and key features such as battery life, flow and reduced noise levels.
Domestic sales and marketing
In the United States, we market and distribute our products directly to consumers through a wide variety of direct-to-consumer sales and marketing strategies including consumer advertising, an inside-sales staff, and a physician referral model. Of the $280.8 million of our 2018 revenue derived from the United States, approximately 50.6% represented direct-to-consumer sales, 41.5% represented sales to traditional home medical equipment providers, distributors (including our private label partner) and resellers, and 7.9% represented direct-to-consumer rentals.
As of December 31, 2018, we employed a marketing team of 8 people, an in-house sales team of 492 people (including 446 inside sales representatives), a field-based sales team of 20 people (including 18 physician sales representatives), and a business-to-business sales team of 4 people.
Our direct-to-consumer sales and marketing efforts are focused on generating awareness and demand for our Inogen One systems and Inogen At Home systems among patients, physicians and other clinicians, and third-party payors.
Patients who choose to use their Medicare or private insurance benefits typically rent our systems. Those who purchase our product outright are typically patients who are not eligible to use their insurance benefits due to their capped rental status, prefer our Inogen One G4 product that is not available for rent, prefer to own the equipment, prefer new equipment, or have an immediate need for our product that cannot be processed in time by their primary insurance carrier (e.g., an upcoming trip). Our ability to rent to Medicare patients directly, bill Medicare and other third-party payors on their behalf, and service patients in their homes requires that we hold a valid Medicare supplier number, are accredited by an independent agency approved by Medicare, and comply with the differing licensure and process requirements in the 50 states in which we serve patients.
6
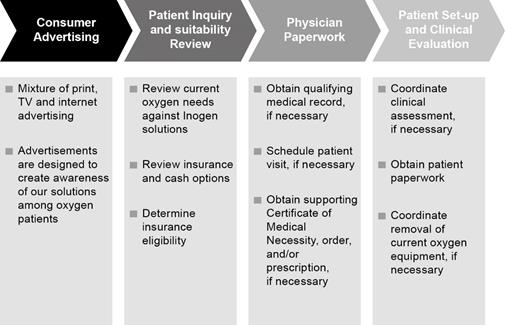
We use a variety of direct-to-consumer marketing strategies to generate interest in our solutions among current oxygen therapy patients. After a patient contacts us, we guide them through product selection and insurance eligibility, and, if they choose to move forward, process the necessary reimbursement and physician paperwork on their behalf, as well as coordinate the shipping, instruction, and clinical setup process. In accordance with Medicare regulations, we do not initially contact patients directly and contact them only upon an inbound inquiry or upon receipt of a physician’s order. The chart below describes our United States direct-to-consumer sales and rental process.
We engage in a number of other initiatives to increase awareness, demand, and orders for Inogen One systems and Inogen At Home systems. These include attendance at oxygen therapy support groups, guest speaking arrangements at trade shows, and product demonstrations, as requested. Additionally, we are targeting private payors to become an in-network provider of oxygen therapy solutions, which we expect will reduce patient co-insurance amounts associated with using our solution. We believe this will result in both increased conversion of our initial leads, as well as direct referrals from insurance companies in some cases.
To supplement the direct-to-consumer marketing model, we are also utilizing a physician referral model as a complementary sales method. Under this model, our field sales representatives work with physicians in the representative’s territory to help physicians understand our products and the value these products provide for patients. We believe that by educating physicians on our products, we can cost-effectively supplement our direct-to-consumer sales and rentals and capture a greater number of patients earlier in the course of their oxygen therapy.
Our direct-to-consumer marketing strategies also create demand for our products among other homecare equipment providers and business partners. In addition to generating consumer demand, we believe our products can create value for our business partners by either creating a retail sale opportunity for them or by reducing the need for costly home deliveries associated with oxygen tanks.
We also sell to resellers and traditional homecare providers in the United States, Canada, Europe, the Asia-Pacific region, Latin America, the Middle East and Africa that choose to deploy our products to long-term oxygen therapy patients. These customers market the benefits of our products to oxygen therapy patients through consumer advertising and/or retail locations or to physicians through field-based sales representatives. We believe that in addition to the marketing efforts employed by our business customers, our own direct-to-consumer marketing efforts in the United States result in patient interest that our business customers field.
7
We also sell to traditional homecare providers that offer our products to patients through insurance reimbursement or retail worldwide. Homecare providers that employ the standard delivery model with oxygen tanks need to replace the oxygen tanks on a regular basis by picking up the empty oxygen tanks and delivering full oxygen tanks for the patient. The delivery model has historically necessitated that a homecare provider have a facility near the oxygen patients that it serves and that the provider has invested in personnel, trucks, etc. to facilitate routine deliveries. The cost to deliver the oxygen tanks to patients is significant for many providers in the standard delivery model. Homecare providers that have adopted Inogen products have been able to reduce the costly deliveries associated with oxygen tanks since our products generate their own oxygen and don’t need to be refilled. Our business-to-business sales and marketing strategy for these customers is to raise awareness of our solutions and educate homecare providers on how our products may be able to reduce their total cost of ownership of servicing oxygen patients. As a homecare provider ourselves, we are able to help our business customers adopt a non-delivery long-term oxygen therapy model utilizing patient preferred portable oxygen concentrators. We also private label our product with a business partner that sells to traditional homecare providers. Our private label partner employs field sales representatives that call on homecare providers to showcase the benefits of our products.
Concentration of Customers
We primarily sell our products to traditional home medical equipment providers, distributors, and resellers in the United States and in foreign countries on a credit basis. We also sell our products direct to consumers on a primarily prepayment basis. One single customer, OxyGo HQ Florida (previously named Applied Home Healthcare Equipment), our private label distribution partner, represented more than 10% of our total revenue for the years ended December 31, 2018, 2017 and 2016. Two customers each represented more than 10% of our net accounts receivable balance with accounts receivable balances of $16.2 million and $4.2 million, respectively, as of December 31, 2018, and accounts receivable balances of $10.4 million and $6.5 million, respectively, as of December 31, 2017.
We also rent products directly to consumers for insurance reimbursement, which resulted in a customer concentration relating to Medicare’s service reimbursement programs in 2016. Medicare’s service reimbursement programs accounted for 72.6% of rental revenue in the year ended December 31, 2016 and based on total revenue was 12.4% for the year ended December 31, 2016. Medicare did not represent more than 10% of our total revenue in the years ended December 31, 2018 and 2017. Medicare did not represent more than 10% of our net accounts receivable balance as of December 31, 2018 and December 31, 2017.
International
Approximately 21.6% of our total revenue was from outside the United States in 2018. We sell through distributors, resellers, and home medical equipment providers in certain markets within Canada, Europe, the Asia-Pacific region, Latin America, the Middle East, and Africa. We sell our products in 46 countries outside the United States through distributors or directly to large “house” accounts, which include gas companies and home oxygen providers. In this case, we sell to and bill the distributor or house accounts directly, leaving the patient billing, support, and clinical setup to the local provider. As of December 31, 2018, we had 9 people located in the United States who focused on selling our products and providing service and support to distributors and house accounts worldwide and 13 employees located in Europe who provided sales, customer service, and repair services to a portion of our international customers. No single international customer and no single foreign country represented more than 10% of our total revenue in 2018, 2017 or 2016.
International sales revenue grew to $77.3 million in 2018 from $55.5 million in 2017. We believe that the international market is attractive for the following reasons:
|
|
• |
more favorable reimbursement in certain countries, including France and the United Kingdom, where portable oxygen concentrators receive more favorable reimbursement than in the United States; |
|
|
• |
less developed oxygen delivery infrastructure in some countries. We believe that some countries outside the United States have less developed oxygen delivery infrastructure than in the United States. As a result, portable oxygen concentrators enable providers to reach and service patients they cannot economically reach with the delivery model; and |
|
|
• |
an absence of reimbursement for any ambulatory long-term oxygen therapy modalities in some countries, resulting in patients bearing all of the cost of ambulatory long-term oxygen therapy and therefore becoming more involved in the selection of the modality. In Australia, for example, patients shoulder the burden of all costs associated with ambulatory long-term oxygen therapy. In these cases, they tend to choose products like portable oxygen concentrators that provide a higher level of personal freedom. |
8
We will continue to focus on building out our international sales efforts. In 2017, we added a European customer support site in the Netherlands after acquiring a previous distributor, MedSupport, now operating under Inogen Europe B.V. This site offers multi-lingual customer service, repair services, and basic distribution, to improve our European customer support at lower cost. Also in support of our European operations, we began production of our Inogen One G3 concentrator in the fourth quarter of 2017 using a contract manufacturer, Foxconn, located in the Czech Republic to improve our ability to service our European customers.
Order fulfillment and customer support
Our procedures enable us to package and ship a system directly to the patient in the patient’s preferred configuration the same day the order is received in most cases. This enables us to minimize the amount of finished goods inventory we keep on hand. Our primary logistics partner is United Parcel Service, or UPS. UPS supports our domestic shipments and provides additional services that support our direct-to-consumer oxygen therapy program. The UPS pick up service is used to retrieve products requiring repair and systems that are no longer needed by the patient. Additionally, UPS, when necessary and requested by us, will go into a patient’s home to remove a replacement product from the box, package the failed device and return it to us. In this manner, we are able to operate as a remote provider while maintaining the level of customer service of a local oxygen therapy provider. FedEx primarily supports our international shipments that originate from the United States and limited domestic shipments.
We believe it is important to provide patients with quality customer support to achieve satisfaction with our products and optimal outcomes. As of December 31, 2018, we had a dedicated customer service team of 55 people who were trained on our products, a clinical support team of 22 people who were licensed nurses or respiratory therapists, and a dedicated billing services team of 80 people. We provide our patients with a dedicated 24/7 hotline. Via the hotline, patients have direct access to our customer service representatives, who can handle product-related questions. Additionally, clinical staff is on call 24/7 and available to patients whenever either the patient or the customer service representative deems appropriate. Our dedicated billing services team is available to answer patient questions regarding invoicing, reimbursement, and account status during normal business hours. We receive no additional reimbursement for patient support, but provide high-quality customer service to enhance patient comfort, satisfaction, compliance, and safety with our products.
Third-party reimbursement
Medicare and private insurance rentals represented approximately 6.2% of our total revenue in 2018, down significantly from 9.6% of our total revenue in 2017, primarily due to increased sales revenue with a continued focus on sales versus rentals and declines in patients on service. In cases where we rent our long-term oxygen therapy solutions directly to patients, we bill third-party payors, such as Medicare or private insurance, for monthly rentals on behalf of our patients. We process and coordinate all physician paperwork necessary for reimbursement of our solutions. A common medical criterion for long-term oxygen therapy reimbursement is insufficient blood oxygen saturation level. Our team in sales and sales administration are trained on how to verify benefits, review medical records and process physician paperwork. Additionally, an independent internal review is performed, and our products are not deployed until after physician paperwork is processed and reimbursement eligibility is verified and communicated to the patient.
We rely primarily on reimbursement from Medicare and secondarily from Medicare Advantage, private payors, Medicaid and patients for our rental revenue. For the year ended December 31, 2018, approximately 78.0% of our rental revenue was derived from Medicare’s service reimbursement programs. The U.S. list price for our stationary oxygen rentals (HCPCS E1390) is $260 per month and the U.S. list price for our oxygen generating portable equipment (OGPE) rentals (HCPCS E1392) is $70 per month. Medicare reimbursement rates vary based on region. Rental revenue includes payments for products, disposables, and customer service/support. The average Medicare reimbursement rates in competitive bidding areas in 2018 were $77.03 a month for E1390 and $36.06 a month for E1392. These are the two primary codes that we bill to Medicare and other payors for our oxygen product rentals.
Effective January 1, 2019, Medicare beneficiaries may receive durable medical equipment from any Medicare-enrolled supplier until new contracts are in effect under the next round of competitive bidding, which is not expected until January 1, 2021. Reimbursement rates between January 1, 2019 and December 31, 2020 are set at the current pricing level throughout the United States for all Medicare patients, subject to Consumer Price Index (CPI) and budget neutrality adjustments. Pricing in competitive bidding areas is subject to annual CPI adjustments beginning in 2019 until the next bidding round takes place. However, Centers for Medicare and Medicaid Services (CMS) also changed the calculation on budget neutrality to apply the offset to all oxygen and oxygen equipment classes beginning January 1, 2019 instead of previously only applying these adjustments to stationary oxygen equipment and oxygen contents. Based on these CPI and budget neutrality adjustments, effective January 1, 2019, the average Medicare reimbursement rates were reduced to $72.92 a month for E1390 and $35.72 a month for E1392 in these regions that were previously subject to competitive bidding. Medicare also established new payment classes for liquid oxygen equipment and high flow portable liquid oxygen contents effective January 1, 2019.
9
In the next round of durable medical equipment, prosthetics, orthotics and supplies (DMEPOS) competitive bidding program, there have been some revisions to the bidding methodology including the plan to implement bid surety bond requirements, lead item pricing, and setting reimbursement rates at the maximum winning bid rate instead of the median winning bid rate. It is unclear how this will impact pricing at that time. We expect additional clarity on the next round of competitive bidding in 2019.
In addition to regional pricing, CMS imposed different pricing on “frontier states” and rural areas. CMS defines frontier states as states where more than 50% of the counties in the state have a population density of 6 people or less per square mile and rural states are defined as states where more than 50% of the population lives in rural areas per census data. Current frontier states include MT, ND, SD and WY; rural states include ME, MS, VT and WV; and non-contiguous United States areas include AK, HI, Guam and Puerto Rico. Effective June 1, 2018 through December 31, 2020, for frontier and rural states, frontier and rural zip codes in non-frontier/rural states and non-contiguous United States areas, the single payment amount will be 50/50 blended reimbursement rates based on an average of the pre-competitive bidding reimbursement rates and the current average reimbursement rates to account for higher servicing costs in these areas. We estimate that less than 10% of our patients would be eligible to receive the higher reimbursement rates based on the geographic locations of our current patient population.
Cumulatively in previous rounds of competitive bidding, we were offered contracts for a substantial majority of the Competitive Bidding Areas (CBA) and product categories for which we submitted bids. Effective January 1, 2017, we believe we had access to over 85% of the Medicare oxygen therapy market based on our analysis of the 103 CBAs that we won out of the 130 total CBAs. These 130 CBAs represent approximately 59% of the market with the remaining approximately 41% of the market not subject to competitive bidding. As of January 1, 2019, we can now choose to accept Medicare oxygen patients throughout the United States. As of July 2018, we are operating in all 50 states in the U.S. We did not sell or rent to patients in Hawaii due to the licensure requirements from inception to June 2018.
We cannot guarantee that we will be offered contracts in subsequent rounds of competitive bidding. In all five rounds of competitive bidding in which we have participated, we have gained access to certain CBAs and been excluded from other CBAs.
Medicare revenue, including patient co-insurance and deductible obligations, represented 4.8% of our total revenue in the year ended December 31, 2018.
Medicare reimbursement for oxygen rental equipment is limited to a maximum of 36 months within a 60-month service period, and the equipment remains the property of the home oxygen supplier. The supplier that billed Medicare for the 36th month of service continues to be responsible for the patient’s oxygen therapy needs for months 37 through 60, and there is generally no additional reimbursement for oxygen generating portable equipment for these later months. Medicare does not separately reimburse suppliers for oxygen tubing, cannulas and supplies that may be required for the patient. The supplier is required to keep the equipment provided in working order and in some cases, Medicare will reimburse for repair costs. At the end of the five-year useful life of the equipment, the patient may request replacement equipment and, if he or she can be re-qualified for the Medicare benefit, a new maximum 36-month payment cycle out of the next 60 months of service would begin. The supplier may not arbitrarily issue new equipment. We have analyzed the potential impact to revenue associated with patients in the capped rental period and have deferred $0 associated with the capped rental period as of December 31, 2018 and December 31, 2017. Our capped patients as a percentage of total patients on service was approximately 19.1% as of December 31, 2018, which is higher than the capped patients as a percentage of total patients on service of approximately 17.0% as of December 31, 2017. The percentage of capped patients may fluctuate over time as new patients come on service, patients come off of service before and during the capped rental period, and existing patients enter the capped rental period.
Our obligations to service Medicare patients over the rental period include supplying working equipment that meets each patient’s oxygen needs pursuant to his/her doctor’s prescription and certificate of medical necessity form and supplying all disposables required for the patient to operate the equipment, including cannulas, filters, replacement batteries, carts and carry bags, as needed. If the equipment malfunctions, we must repair or replace the equipment. We determine what equipment the patient receives, as long as that equipment meets the physician’s prescription, and we can deploy used assets in working order as long as the prescription requirements are met. We must also procure a recertification of the certificate of medical necessity from the patient’s doctor to confirm the patient’s need for continued oxygen therapy one year after the patient first receives oxygen therapy and one year after each new 36-month reimbursement period begins. The patient can choose to receive oxygen supplies and services from another supplier at any time, but the supplier may only transition the patient to another supplier in certain circumstances.
10
On November 2, 2017, a bi-partisan bill was introduced in the House of Representatives that would provide relief from competitive bidding in non-bid areas. This bill has 158 co-sponsors as of December 31, 2018. If passed, the bill would extend a retroactive delay of a second round of reimbursement cuts for Medicare beneficiaries from January 1, 2017 to January 1, 2019 based on the reimbursement rates effective on January 1, 2016. The legislation also proposes to remedy a double-dip cut to oxygen payments caused by the misapplication of a 2006 budget neutrality offset balancing increased utilization for oxygen generating portable equipment with lower reimbursement for stationary equipment.
On February 12, 2018, the current presidential administration sent Congress a 2019 budget proposal that included language on competitive bidding. Specifically, the proposal would eliminate the requirement under the competitive bidding program that CMS pay a single payment amount based on the median bid price, proposing instead that CMS pay winning suppliers at their own bid amounts. Additionally, this proposal would expand competitive bidding to all areas of the country, including rural areas, which will be based on competition in those areas rather than on competition in urban areas. This specific proposal is estimated to save the government $6.5 billion over 10 years. In addition to changes to competitive bidding, the 2019 budget proposal would enable CMS not to impose the face-to-face requirement on all providers for durable medical equipment. Furthermore, the proposal seeks to address excessive billing of durable medical equipment that requires refills or serial claims. Specifically, Medicare would gain authority to test whether using a benefits manager for serial durable medical equipment claims would result in lower improper payments and reductions in inappropriate utilization. The benefits manager would be responsible for ensuring beneficiaries were receiving the correct quantity of supplies or service for the appropriate time period. Lastly, the proposal would expand prior authorization to additional items and services that are both high-cost and at high-risk for improper payments. These provisions were not included in the latest omnibus budget, so it is unclear if any of these proposals will be implemented. We believe additional cuts to reimbursement would continue to drive conversion to non-delivery technologies, including portable oxygen concentrators (POC).
As of December 31, 2018, we had 91 contracts with Medicaid, Medicare Advantage, and private payors. These contracts qualify us as an in-network provider for these payors. As a result, patients can rent or purchase our systems at the same patient obligation as other in-network oxygen suppliers. Based on our patient population, we believe approximately 40% of all oxygen therapy patients are covered by Medicare Advantage and other private payors. Private payors typically provide reimbursement at a rate similar to Medicare allowables for in-network plans. We anticipate that private payor reimbursement levels will generally be reset in accordance with Medicare payment amounts.
We cannot predict the full extent to which reimbursement for our products will be affected by competitive bidding, the 2019 federal budget or future federal budgets, or by initiatives to reduce costs for private payors. We believe that we are well positioned to respond to the changing reimbursement environment because our product offerings are innovative, patient-focused and cost-effective. We have historically been able to reduce our costs through scalable manufacturing, better sourcing, continuous innovation, and reliability improvements, as well as innovations that reduce our product service costs by minimizing exchanges, such as user replaceable batteries. As a result of design changes, supplier negotiations, bringing manufacturing and assembly largely in-house and our commitment to driving efficient manufacturing processes, we have reduced our overall system cost 58% from 2009 to 2018. We intend to continue to seek ways to reduce our cost of revenue through manufacturing and design improvements.
For additional discussion of the impact of the recent Medicare reimbursement proposals, see “Risk Factors” herein.
Manufacturing and raw materials
We have been developing and refining the manufacturing of our Inogen One systems since 2004. While nearly all of our manufacturing and assembly processes were originally outsourced, assembly of the compressor, sieve bed, concentrator and certain manifolds sold in the U.S. is now conducted in-house in order to improve quality control and reduce cost. Additionally, we use lean manufacturing practices to maximize manufacturing efficiency. We rely on third-party manufacturers to supply several components of our Inogen One and Inogen At Home systems. We typically enter into supply agreements for these components that specify quantity and quality requirements and delivery terms. In certain cases, these agreements can be terminated by either party upon relatively short notice but in other instances we are obligated to purchase minimum quantities. We have elected to source certain key components from single sources of supply, including our batteries, motors, valves, and some molded plastic components. We believe that maintaining a single source of supply allows us to control production costs and inventory levels and to manage component quality. In order to mitigate against the risks related to a single source of supply, we qualify alternative suppliers and develop contingency plans for responding to disruptions. However, any reduction or halt in supply from one of these single-source suppliers could limit our ability to manufacture our products or devices until a replacement supplier is found and qualified.
11
We currently manufacture in two leased buildings in Richardson, Texas and Goleta, California, that we have registered with the Food and Drug Administration (FDA), and maintain a Quality Management system for which we have obtained International Standards Organization (ISO) 13485 certification. We also began production of our Inogen One G3 concentrators in the fourth quarter of 2017 using a contract manufacturer, Foxconn, located in the Czech Republic to improve our ability to service our European customers. We believe we and our manufacturing partner have sufficient capacity to meet anticipated demand.
Our entire organization is responsible for quality management. Our Quality Assurance and Regulatory Affairs departments oversee this by tracking component, device and organization performance and by training team members outside the Quality Assurance and Regulatory Affairs departments to become competent users of our Quality Management system. By measuring component performance, communicating daily with the production group and our suppliers, and reviewing customer complaints, our Quality Assurance department, through the use of our corrective action program, drives and documents continuous performance improvement of our suppliers and internal departments. Our Regulatory Affairs department also trains internal quality auditors to audit our adherence to the Quality Management system. Our Quality Management system has been certified to ISO 13485:2016 by BSI, a Notified Body.
We began using a contract manufacturer for production of our Inogen One G3 concentrators in the fourth quarter of 2017 to improve our ability to service our European customers. In 2018, our contract manufacturer produced the vast majority of the Inogen One G3 concentrators required to support our European demand and we expect this to continue in 2019. We expect to maintain our assembly operations for our Inogen One concentrators and Inogen At Home concentrators at our facilities in Richardson, Texas and Goleta, California. This has allowed us to continue to expand our manufacturing capacity and redirect our U.S. manufacturing activities to focus on growth in the U.S., on our latest product, the Inogen One G4, and on our upcoming launch of the Inogen One G5.
As a medical device manufacturer, our manufacturing facilities, including those facilities outside of the United States, are subject to periodic inspection by the FDA and certain corresponding regulatory agencies and authorities. We have been audited six times since April 2012 by the FDA and found to be in compliance with Good Manufacturing Practices. We have completed four surveillance audits and two recertification audits by our notified body over the same period. In addition, two transfer audits (one combined with a surveillance audit tallied above and one standalone), one unannounced audit, one initial Medical Device Single Audit Program (MDSAP) audit, one initial extension of scope audit for Inogen Europe B.V. and one site addition audit were also completed. In any given year, we may identify non-conformance and objectionable conditions. As of December 31, 2018, all observations resulting in non-conformance or objectionable conditions have been minimal and have been addressed. Our Inogen One systems and Inogen At Home system have received pre-market clearance under Section 510(k) of the FDCA. The modifications made to our Inogen One G2, Inogen One G3, and Inogen One G4 systems represent non-significant modifications to the original Inogen One system, have the same indications for use, and are covered under our initial Inogen One 510(k) clearance.
As of December 31, 2018, we had 285 employees in operations, manufacturing, quality assurance and repair in the United States.
Research and development
We are committed to ongoing research and development to stay at the forefront of patient preference in the oxygen concentrator field. As of December 31, 2018, our research and development staff included 34 engineers and scientists with expertise in air separation, compressors, pneumatics, electronics, embedded software, mechanical design, sensor, automation, connectivity and manufacturing automation. Our current research and development efforts are focused primarily on increasing functionality, improving design for ease-of-use, and reducing production costs of our Inogen One systems and Inogen At Home systems, as well as developing our next-generation oxygen concentrators. We have leveraged our thirty-three issued patents while also reducing the product manufacturing costs approximately 58% from 2009 to 2018.
Utilizing lean product development methodologies, we have released five products since 2004, including our Inogen One G1 in October 2004, our Inogen One G2 in March 2010, our Inogen One G3 in September 2012, our Inogen At Home system in October 2014, and our Inogen One G4 in May 2016. We also launched the Inogen Connect platform in December 2018 in our direct-to-consumer channel and in February 2019 in our domestic business-to-business channel. Our dedication to continuous improvement has also resulted in five mid-cycle product updates and numerous incremental improvements. Development projects utilize a combination of rapid prototyping and accelerated life testing methods to ensure products are taken from concept to commercialization in a fast and capital efficient manner. We leverage our direct patient expertise to rapidly gain insight from end users and to identify areas of innovation that we believe will lead to higher-quality products and lower total cost of ownership for our products.
We continue to focus our efforts on design and functionality improvements that enhance patient quality of life and reduce service costs.
12
The long-term oxygen therapy market is a highly competitive industry. We compete with a number of manufacturers and distributors of portable oxygen concentrators, as well as providers of other long-term oxygen therapy solutions such as home delivery of oxygen tanks or cylinders, stationary concentrators, transfilling concentrators, and liquid oxygen.
Our significant manufacturing competitors are Respironics (a subsidiary of Koninklijke Philips N.V.), Invacare Corporation, Caire Medical (subsidiary of NGK Spark Plug), DeVilbiss Healthcare (a subsidiary of Drive Medical), O2 Concepts, Precision Medical, Resmed, and Gas Control Equipment (subsidiary of Colfax). Additional competitors have also pre-announced upcoming product launches of portable oxygen concentrators expected in 2019 including 3B Medical and SysMed. Given the relatively low barriers to entry in the oxygen therapy device manufacturing market, we expect that the industry will become increasingly competitive in the future. For example, some major manufacturing competitors have implemented direct-to-consumer sales models which may increase their competitiveness and sales to patients; however, these strategies are limited to direct-to-consumer sales and do not include direct-to-consumer rentals where they would be responsible to meet national accreditation and state-by-state licensing requirements, secure Medicare billing privileges, and compete directly with the home medical equipment providers that many rely on across their entire homecare businesses. Manufacturing companies compete for sales to providers primarily on the basis of price, quality/reliability, financing, bundling, product features, and service. We believe that we compete favorably with respect to these factors, due to our manufacturing competitors’ reliance on home medical equipment distribution, which compresses their margins and limits their ability to invest in product features that address consumer preferences.
For many years, Lincare, Inc. (a subsidiary of the Linde Group), Apria Healthcare, Inc., AdaptHealth (formerly QMES LLC), Aero Care Holdings, Inc, and Rotech Healthcare, Inc. have been among the market leaders in providing long-term oxygen therapy in the United States, while the remaining U.S. long-term oxygen therapy market is serviced by local providers. Because many oxygen therapy providers may have difficulty providing service at the prevailing Medicare reimbursement rates, we expect more industry consolidation. Oxygen therapy providers compete primarily on the basis of product features and service, rather than price, since reimbursement levels are established by Medicare and Medicaid, or by the individual determinations of private payors. We believe that the investment made by long-term oxygen therapy providers in the physical distribution required for oxygen delivery limits their ability to easily switch their business model.
Some of our competitors are large, well-capitalized companies with significantly greater resources than we have. As a consequence, they are able to spend more aggressively on product development, marketing, sales and other product initiatives than we can. Some of these competitors have:
|
|
• |
significantly greater name recognition; |
|
|
• |
established relationships with healthcare professionals, customers and third-party payors; |
|
|
• |
established distribution networks; |
|
|
• |
additional lines of products, and the ability to offer rebates or bundle products to offer higher discounts, lower pricing, longer warranties, financing or extended terms, or other incentives to gain a competitive advantage; |
|
|
• |
greater history in conducting research and development, manufacturing, marketing and obtaining regulatory approval for oxygen device products; and |
|
|
• |
greater financial and human resources for product development, sales and marketing, patent litigation and customer financing. |
As a result, our competitors may be able to respond more quickly and effectively than we can to new or changing opportunities, technologies, standards or customer requirements. In light of these advantages that our competitors maintain, even if our technology and direct-to-consumer distribution strategy is more effective than the technology and distribution strategy of our competitors, current or potential customers might accept competitor products and services in lieu of purchasing our products. We anticipate that we will face increased competition in the future as existing companies and competitors develop new or improved products and distribution strategies and as new companies enter the market with new technologies and distribution strategies. We may not be able to compete effectively against these organizations. Our ability to compete successfully and to increase our market share is dependent upon our reputation for providing high-quality, light weight, and state-of-the-art products with responsive and professional services to achieve strong customer satisfaction. Increased competition in the future could adversely affect our revenue, revenue growth rate, margins and market share.
13
Inogen One systems, Inogen At Home systems and related accessories are medical devices subject to extensive and ongoing regulation by the FDA, as well as other federal and state regulatory bodies in the United States and comparable authorities in other countries. The FDA regulations govern the following activities that we perform, or that are performed on our behalf, to ensure that medical products distributed domestically or exported internationally are safe and effective for their intended uses: product design and development, pre-clinical and clinical testing, manufacturing, labeling, storage, pre-market clearance or approval, record keeping, product marketing, advertising and promotion, sales and distribution, and post-marketing surveillance.
FDA’s pre-market clearance and approval requirements
Unless an exemption applies, each medical device we seek to commercially distribute in the United States will require either a prior Section 510(k) of the Food, Drug and Cosmetic Act, or 501(k) clearance or a pre-market approval from the FDA. Medical devices are classified into one of three classes—Class I, Class II or Class III—depending on the degree of risk associated with each medical device and the extent of control needed to ensure safety and effectiveness. Devices deemed to pose lower risks are placed in either Class I or II, which requires the manufacturer to submit to the FDA a premarket notification requesting permission to commercially distribute the device. This process is generally known as 510(k) clearance. Some low risk devices are exempted from this requirement. Devices deemed by the FDA to pose the greatest risk, such as life-sustaining, life-supporting or implantable devices, or devices deemed not substantially equivalent to a previously cleared 510(k) device, are placed in Class III, requiring premarket approval.
510(k) clearance pathway
When a 510(k) clearance is required, we must submit a premarket notification to the FDA demonstrating that our proposed device is substantially equivalent to a previously cleared and legally marketed 510(k) device or a device that was in commercial distribution before May 28, 1976 for which the FDA has not yet called for the submission of a pre-market approval application. The performance goal for FDA to make a decision is within 90 FDA Days (calculated as the number of calendar days between the date the 510(k) was received and date of a decision, excluding the days the submission was on hold for an Additional Information request). As a practical matter, clearance often takes significantly longer. The FDA must “accept” the submission and may require further information, including clinical data, to make a determination regarding substantial equivalence. If the FDA determines that the device, or its intended use, is not substantially equivalent to a previously-cleared device or use, the FDA will place the device, or the particular use, into Class III. We obtained 510(k) clearance for the original Inogen One system on May 13, 2004. We market the Inogen One G3 and Inogen One G4 systems pursuant to the original Inogen One 510(k) clearance. We obtained 510(k) clearance for the Inogen At Home system on June 20, 2014.
Pre-market approval pathway
A pre-market approval application must be submitted to the FDA if the device cannot be cleared through the 510(k) process. The pre-market approval application process is much more demanding than the 510(k) premarket notification process. A pre-market approval application must be supported by extensive data, including but not limited to technical, preclinical, clinical trials, manufacturing and labeling to demonstrate to the FDA’s satisfaction reasonable evidence of safety and effectiveness of the device.
After a pre-market approval application is submitted and the FDA determines that the application is sufficiently complete to permit a substantive review, the FDA will accept the application for review. The FDA has 180 days to review an “accepted” pre-market approval application, although the review of an application generally occurs over a significantly longer period of time and can take up to several years. During this review period, the FDA may request additional information or clarification of the information already provided. Also, an advisory panel of experts from outside the FDA may be convened to review and evaluate the application and provide recommendations to the FDA as to the approvability of the device. In addition, the FDA will conduct a preapproval inspection of the manufacturing facility to ensure compliance with quality system regulations.
14
Clinical trials are almost always required to support pre-market approval and are sometimes required for 510(k) clearance. In the United States, these trials generally require submission of an application for an Investigational Device Exemption, or IDE, to the FDA. The IDE application must be supported by appropriate data, such as animal and laboratory testing results, showing it is safe to test the device in humans and that the testing protocol is scientifically sound. The IDE must be approved in advance by the FDA for a specific number of patients unless the product is deemed a non-significant risk device eligible for more abbreviated IDE requirements. Clinical trials for significant risk devices may not begin until the IDE application is approved by the FDA and the appropriate institutional review boards, or IRBs, at the clinical trial sites. We, the FDA or the IRB at each site at which a clinical trial is being performed may suspend a clinical trial at any time for various reasons, including a belief that the risks to study subjects outweigh the benefits. Even if a trial is completed, the results of clinical testing may not demonstrate the safety and efficacy of the device, may be equivocal or may otherwise not be sufficient to obtain approval or clearance of the product.
Pervasive and ongoing regulation by the FDA and foreign agencies
Even after a device receives clearance or approval and is placed on the market, numerous regulatory requirements apply. These include:
|
|
• |
establishment registration and device listing; |
|
|
• |
quality system regulation, which requires manufacturers, including third-party manufacturers, to follow stringent design, testing, control, documentation and other quality assurance procedures during all aspects of the manufacturing process; |
|
|
• |
labeling regulations and the FDA prohibitions against the promotion of products for un-cleared, unapproved or “off-label” uses, and other requirements related to promotional activities; |
|
|
• |
medical device reporting regulations, which require that manufacturers report to the FDA if their device may have caused or contributed to a death or serious injury or malfunctioned in a way that would likely cause or contribute to a death or serious injury if the malfunction were to recur; |
|
|
• |
corrections and removals reporting regulations, which require that manufacturers report to the FDA field corrections and product recalls or removals if undertaken to reduce a risk to health posed by the device or to remedy a violation of the Federal Food, Drug and Cosmetic Act that may present a risk to health; and |
|
|
• |
post-market surveillance regulations, which apply when necessary to protect the public health or to provide additional safety and effectiveness data for the device. |
After a device receives 510(k) clearance or a pre-market approval, any modification that could significantly affect its safety or effectiveness, or that would constitute a major change in its intended use, will require a new clearance or approval. The FDA requires each manufacturer to make this determination initially, but the FDA can review any such decision and can disagree with a manufacturer’s determination. We have modified various aspects of our Inogen One systems since receiving regulatory clearance, but we believe that new 510(k) clearances are not required for these modifications. If the FDA disagrees with our determination not to seek a new 510(k) clearance, the FDA may retroactively require us to seek 510(k) clearance or pre-market approval. The FDA could also require us to cease marketing and distribution and/or recall the modified device until 510(k) clearance or pre-market approval is obtained. Also, in these circumstances, we may be subject to significant regulatory fines and penalties.
Failure to comply with applicable regulatory requirements can result in enforcement action by the FDA, which may include any of the following sanctions: warning letters, fines, injunctions, civil or criminal penalties, recall or seizure of our products, operating restrictions, partial suspension or total shutdown of production, refusing our request for 510(k) clearance or pre-market approval of new products, rescinding previously granted 510(k) clearances or withdrawing previously granted pre-market approvals.
As a medical device manufacturer, our manufacturing facilities are subject to periodic inspection by the FDA and certain corresponding regulatory agencies and authorities. We have been audited six times since April 2012 by the FDA and found to be in compliance with Good Manufacturing Practices. We have completed four surveillance audits and two recertification audits by our notified body over the same period and identified minor non-conformances, all of which were addressed. In addition, two transfer audits (one combined with a surveillance audit tallied above and one standalone), one unannounced audit, one initial MDSAP audit, one initial extension of scope audit for Inogen Europe B.V. and one site addition audit were also completed.
International sales of medical devices are subject to foreign government regulations and registration, which may vary substantially from country to country. The time required to obtain approval by a foreign country may be longer or shorter than that required for FDA approval, and the requirements may differ. There is a trend towards harmonization of quality system standards among the European Union, United States, Canada and various other industrialized countries.
15
Licensure, registrations, and accreditation
In April 2009, we became an accredited Durable Medical Equipment, Prosthetics, Orthotics, and Supplies Medicare supplier by the Accreditation Commission for Health Care for our Goleta, California facility for Home/Durable Medical Equipment Services for oxygen equipment and supplies. Our Medicare accreditation must be renewed every three years by passing an on-site inspection. Our current accreditation with Medicare is due to expire in May 2021. Several states require that durable medical equipment providers be licensed in order to sell products to patients in that state. Certain of these states require that durable medical equipment providers maintain an in-state location. Most of our state licenses are renewed on an annual or bi-annual basis. Although we believe we are in compliance with all applicable state regulations regarding licensure requirements, if we were found to be non-compliant, we could lose our licensure in that state, which could prohibit us from selling our current or future products to patients in that state. Loss of any state licensure or operating without a required state license may also impact our Medicare enrollment, which requires us to be properly licensed in every state where we are registered with Medicare to do business. Loss or reprimand of our Medicare enrollment may also affect any Medicare competitive bidding program contracts we may apply for in the future. In addition, we are subject to certain state laws regarding professional licensure. We believe that our certified clinicians are in compliance with all such state laws. If our clinicians were to be found non-compliant in a given state, we would need to modify our approach to providing education, clinical support and customer service in such state.
Federal anti-kickback and self-referral laws
The Federal Anti-Kickback Statute prohibits the knowing and willful offer, payment, solicitation or receipt of any form of remuneration overtly or covertly, in cash or in kind, in return for, or to induce the:
|
|
• |
referral of an individual to a person for the furnishing or arranging for the furnishing of items or services reimbursable under Medicare, Medicaid or other governmental programs; or |
|
|
• |
purchase, lease, or order of, or the arrangement or recommendation of the purchasing, leasing, or ordering of any item or service reimbursable under Medicare, Medicaid or other governmental programs. |
The Federal Anti-Kickback Statute applies to our arrangements with our United States sales representatives, customers and healthcare providers. Although we believe that we have structured such arrangements to be in compliance with the Anti-Kickback Statute and other applicable laws, regulatory authorities may determine otherwise. Non-compliance with the Federal Anti-Kickback Statute can result in cancellation of our provider numbers and exclusion from Medicare, Medicaid or other governmental programs, restrictions on our ability to operate in certain jurisdictions, as well as civil and criminal penalties, any of which could have an adverse effect on our business and results of operations.
Federal law also includes a provision commonly known as the “Stark Law,” which prohibits a physician from referring Medicare or Medicaid patients to an entity providing “designated health services,” which includes durable medical equipment, if the physician or immediate family member of the physician, has an ownership or investment interest in or compensation arrangement with such entity that does not comply with the requirements of a Stark exception. Violation of the Stark Law could result in denial of payment, disgorgement of reimbursements received under a non-compliant arrangement, civil penalties, and exclusion from Medicare, Medicaid or other governmental programs. Although we believe that we have structured our provider arrangements to comply with current Stark Law requirements, these arrangements may not expressly meet the requirements for applicable exceptions from the law.
Additionally, as some of these laws are still evolving, we lack definitive guidance as to the application of certain key aspects of these laws. We cannot predict the final form that these regulations will take or the effect that the final regulations will have on us. As a result, our provider arrangements may ultimately be found to be not in compliance with applicable federal law.
Federal False Claims Act
The Federal False Claims Act provides, in part, that the federal government may bring a lawsuit against any person whom it believes has knowingly presented, or caused to be presented, a false or fraudulent request for payment to the federal government, or who has made a false statement or used a false record to get a claim approved. In addition, amendments in 1986 to the Federal False Claims Act have made it easier for private parties to bring “qui tam” or whistleblower lawsuits against companies. Although we believe that we are in compliance with the federal government’s laws and regulations, if we are found in violation of these laws, penalties include fines ranging from $0.011 to $0.022 million for each false claim, plus three times the amount of damages that the federal government sustained because of the act.
16
The Federal Civil Monetary Penalties Law prohibits the offering or transferring of remuneration to a Medicare or Medicaid beneficiary that the person knows or should know is likely to influence the beneficiary’s selection of a particular supplier of Medicare or Medicaid payable items or services. We sometimes offer customers various discounts and other financial incentives in connection with the sales of our products. While it is our intent to comply with all applicable laws, the government may find that our marketing activities violate the Civil Monetary Penalties Law. If we are found to be in non-compliance, we could be subject to civil monetary penalties of up to $.02 million for each wrongful act, assessment of three times the amount claimed for each item or service and exclusion from Medicare, Medicaid and other governmental programs. In addition, to the extent we are found to not be in compliance, we may be required to curtail or restructure our operations. Any penalties, damages, fines, exclusions, curtailment or restructuring of our operations could adversely affect our ability to operate our business and our financial results.
State fraud and abuse provisions
Many states have also adopted some form of anti-kickback and anti-referral laws and false claims act that may apply to all payors. We believe that we are in compliance with such laws. Nevertheless, a determination of liability under such laws could result in fines and penalties and restrictions on our ability to operate in these jurisdictions.
HIPAA
The Health Insurance Portability and Accountability Act of 1996, or HIPAA, also establish uniform standards governing the conduct of certain electronic healthcare transactions and protecting the security and privacy of individually identifiable health information maintained or transmitted by healthcare providers, health plans and healthcare clearinghouses, which are referred to as “covered entities.” Three standards have been promulgated under HIPAA’s regulations: the Standards for Privacy of Individually Identifiable Health Information, which restrict the use and disclosure of certain individually identifiable health information, the Standards for Electronic Transactions, which establish standards for common healthcare transactions, such as claims information, plan eligibility, payment information and the use of electronic signatures, and the Security Standards, which require covered entities to implement and maintain certain security measures to safeguard certain electronic health information, including the adoption of administrative, physical and technical safeguards to protect such information.
In 2009, Congress passed the American Recovery and Reinvestment Act of 2009, or ARRA, which included sweeping changes to HIPAA, including an expansion of HIPAA’s privacy and security standards. ARRA includes the Health Information Technology for Economic and Clinical Health, or HITECH, which, among other things, made HIPAA’s privacy and security standards directly applicable to business associates of covered entities effective February 17, 2010. A business associate is a person or entity that performs certain functions or activities on behalf of a covered entity that involve the use or disclosure of protected health information in connection with recognized healthcare operations activities. As a result, business associates are now subject to significant civil and criminal penalties for failure to comply with applicable standards. Moreover, HITECH creates a new requirement to report certain breaches of unsecured, individually identifiable health information and imposes penalties on entities that fail to do so. HITECH also increased the civil and criminal penalties that may be imposed against covered entities, business associates and possibly other persons and gave state attorneys general new authority to file civil actions for damages or injunctions in federal courts to enforce the federal HIPAA laws and seek attorney fees and costs associated with pursuing federal civil actions. The 2013 final HITECH omnibus rule modifies the breach reporting standard in a manner that will likely make more data security incidents qualify as reportable breaches.
In addition to federal regulations issued under HIPAA, some states have enacted privacy and security statutes or regulations that, in some cases, are more stringent than those issued under HIPAA. In those cases, it may be necessary to modify our planned operations and procedures to comply with the more stringent state laws. If we fail to comply with applicable state laws and regulations, we could be subject to additional sanctions. Any liability from failure to comply with the requirements of HIPAA, HITECH or state privacy and security statutes or regulations could adversely affect our financial condition. The costs of complying with privacy and security related legal and regulatory requirements are burdensome and could have a material adverse effect on our results or operations.
17
Patient Protection and Affordable Care Act
In addition, there has been a recent trend of increased federal and state regulation of payments made to physicians and other healthcare providers. The Patient Protection and Affordable Care Act, as amended by the Health Care and Education Reconciliation Act, among other things, imposed new reporting requirements on medical device manufacturers for payments or other transfers of value made by them to physicians and teaching hospitals, as well as ownership and investment interests held by physicians and their immediate family members. Failure to submit required information may result in civil monetary penalties of up to an aggregate of $0.17 million per year (or up to an aggregate of $1.128 million per year for “knowing failures”), for all payments, transfers of value or ownership or investment interests that are not timely, accurately and completely reported in an annual submission. Certain states also mandate implementation of commercial compliance programs, impose restrictions on device manufacturer marketing practices and/or require the tracking and reporting of gifts, compensation and other remuneration to physicians and other healthcare professionals.
The Patient Protection and Affordable Care Act also requires healthcare providers to voluntarily report and return an identified Medicare or Medicaid overpayment within 60 days after identifying the overpayment. Failure to repay the overpayment within 60 days will result in the claim being considered a “false claim” and the healthcare provider will be subject to False Claims Act liability.
U.S. Foreign Corrupt Practices Act
Also, the U.S. Foreign Corrupt Practices Act and similar worldwide anti-bribery laws generally prohibit companies and their intermediaries from making improper payments to foreign officials. We cannot assure you that our internal control policies and procedures will protect us from reckless or negligent acts committed by our employees, manufacturers, distributors, partners, collaborators or agents. Violations of these laws, or allegations of such violations, could result in legal fees, fines, penalties or prosecution and have a negative impact on our business, results of operations and reputation.
International regulation
International sales of medical devices are subject to foreign governmental regulations, which vary substantially from country to country. The time required to obtain clearance or approval by a foreign country may be longer or shorter than that required for FDA clearance or approval, and the requirements may be different.
The primary regulatory body in Europe is the European Commission, which has adopted numerous directives and has promulgated standards regulating the design, manufacture, clinical trials, labeling and adverse event reporting for medical devices. Devices that comply with the requirements of a relevant directive will be entitled to bear the European Conformity Marking, or CE Mark, indicating that the device conforms to the essential requirements of the applicable directives and, accordingly, can be commercially distributed throughout the member states of the European Union, and other countries that comply with or mirror these directives. The method of assessing conformity varies depending on the type and class of the product, but normally involves a combination of self-assessment by the manufacturer and a third-party assessment by a notified body, an independent and neutral institution appointed by a country to conduct the conformity assessment. This third-party assessment may consist of an audit of the manufacturer’s quality system, review of technical documentation, and specific testing of the manufacturer’s device. Such an assessment may be required in order for a manufacturer to commercially distribute the product throughout these countries. ISO 13485 certification is a voluntary standard. Quality systems that implement relevant harmonized standards establish the presumption of conformity with the essential requirements for a CE Mark. We have the authorization to affix the CE Mark to our products and to commercialize our devices in the European Union. Our ISO 13485 certification was issued on April 21, 2005 and our EC-Certificate was issued on March 16, 2007. The final form of the European Medical Device Regulation, which will replace Europe’s Medical Device Directive, entered into force on May 25, 2017 and its full application will be on May 26, 2020. The Medical Device Regulation will apply in parallel with the Medical Device Directive for a transition period of three years. Additionally, a new version of ISO 13485 was recently published, beginning a transition period for updating certificates until March 2019.
Before we can sell our devices in Canada, we must submit a license application and obtain clearance, implement and comply with ISO Standard 13485, and undergo an audit by a registrar accredited by Health Canada. On January 25, 2006, we received our Medical Device License in Canada. Health Canada implemented the MDSAP as the sole mechanism for manufacturers to demonstrate compliance with the quality management system requirements of the Medical Devices Regulations. MDSAP replaced the Canadian Medical Devices Conformity Assessment System (CMDCAS) program. As of January 1, 2019, only MDSAP certificates are accepted. In Australia, we must appoint an agent sponsor who will interact on our behalf with the Therapeutics Goods Administration (TGA). We must also prepare a technical file and declaration of conformity to essential requirements under Australian law, provide evidence of CE Marking of the device and submit this information via our agent sponsor to the TGA in a Medical Device Application. On June 4, 2007, we received our Certificate for Inclusion of a Medical Device in Australia.
18
We believe that to maintain a competitive advantage, we must develop and preserve the proprietary aspect of our technologies. We rely on a combination of patent, trademark, trade secret and other intellectual property laws, non-disclosure agreements and other measures to protect our proprietary rights. Currently, we require our employees, public accountants, consultants and advisors to execute non-disclosure agreements in connection with their employment, consulting or advisory relationships with us, where appropriate. We also require our employees, consultants and advisors with whom we expect to work on our current or future products to agree to disclose and assign to us all inventions conceived during the work day, developed using our property or related to our business. Despite any measures taken to protect our intellectual property, unauthorized parties may attempt to copy aspects of our Inogen One or Inogen At Home systems or to obtain and use information that we regard as proprietary.
Patents
As of December 31, 2018, we had eight pending patent applications and thirty-three issued patents relating to the design and construction of our oxygen concentrators and our Intelligent Delivery Technology. We anticipate it could take several years for the most recent of these patent applications to result in issued patents, if successful.
Our patent portfolio contains three principal sets of patents and patent applications. The first set relates to the construction and design of specific Inogen products. For example, U.S. Patent Nos. 8,440,004; 8,366,815; 8,377,181; 8,568,519; 9,592,360; and 10,004,869 are directed to design elements of the Inogen One G2, Inogen One G3, and Inogen at Home oxygen concentrators. These patents expire in 2031 or later and may serve to deter competitors from reverse engineering or copying our design elements. This set of patents and patent applications also contains pending patent applications that relate to the designs of the Inogen One G3, Inogen One G4, and Inogen At Home oxygen concentrators.
The second set of patents and patent applications within our portfolio pertains to operating features and design techniques. U.S. Patent Nos. 7,841,343; 7,585,351; 7,857,894; and 8,142,544 are directed toward efficient operation of the Pressure Swing Adsorption oxygen generating system and the oxygen conserving technology used across the product line. These patents expire in 2025, 2026, 2027 and 2027, respectively (without taking into account any patent term adjustments). U.S. Patent Nos. 8,702,841; 9,220,864; and 9,283,346 are directed towards design features of the Inogen One G3, Inogen One G4, and Inogen at Home products. These patents expire in 2032, 2032, and 2034, respectively (without taking into account any patent term adjustments). These features and designs are developed to facilitate the design, manufacturing, and usefulness of our products. These patents may prevent competitors from achieving the same levels of optimization as found in our products.
The third set of patents and patent applications includes system component designs that may be incorporated into our products. For example, U.S. Patent No. 8,580,015, which expires in 2027 (without taking into account any patent term adjustments), is directed to product improvements that have been utilized in the Inogen One and Inogen One G2 products. Also, within this class of patents are U.S. Patent Nos. 7,686,870 and 7,922,789 that are directed to designs that may be utilized in future Inogen products to improve performance over current product offerings. These patents expire in 2028 and 2023, respectively.
Trademarks
“Inogen,” “Inogen One,” “Inogen One G2,” “Inogen One G3,” “G4,” “G5,” “Oxygenation,” “Live Life in Moments, not Minutes,” “Never Run Out of Oxygen,” “Oxygen Therapy on Your Terms,” “Oxygen.Anytime.Anywhere,” “Reclaim Your Independence,” “Intelligent Delivery Technology,” “Inogen At Home,” and the Inogen design are registered and/or pending trademarks with the United States Patent and Trademark Office of Inogen, Inc. We own trademark registrations for the mark “Inogen” in Australia, Canada, South Korea, Mexico, Europe (European Union registration), and Japan. We own pending applications for the mark “Inogen” in Argentina, Brazil, China, and Ecuador, and an International Registration for the mark “Inogen” designating Colombia, Iceland, India, Israel, New Zealand, Norway, Singapore, Switzerland and Turkey. We own a trademark registration for the mark “イノジェン” in Japan. We own trademark applications for the marks “印诺真” and “艾诺根” in China. We own trademark registrations for the mark “Inogen One” in Australia, Canada, China, South Korea, Mexico, and Europe (European Union registration). We own a trademark registration for the mark “Satellite Conserver” in Canada. We own a trademark registration for the mark “Inogen At Home” in Europe (European Union Registration). We own trademark registrations for the mark “G4” in Europe (European Union registration) and the United Kingdom. We own trademark applications for the Inogen design in Bolivia and China. Other service marks, trademarks, and trade names referred to in this Annual Report on Form 10-K are the property of their respective owners.
19
As of December 31, 2018, we had 1,099 full and part-time employees worldwide, representing 613 in sales, marketing, clinical and client services, 291 in operations, manufacturing, quality assurance and repair, 161 in general administration and 34 in research and development. None of our employees are represented by a collective bargaining agreement. We believe that our employee relations are good.
Environmental matters
Our research and development and manufacturing processes involve the controlled use of hazardous materials, including flammables, toxics, and corrosives. Our research and manufacturing operations produce hazardous chemical waste products. We seek to comply with applicable laws regarding the handling and disposal of such materials. Given the small volume of such materials used or generated at our facilities, we do not expect our compliance efforts to have a material effect on our capital expenditures, earnings, and competitive position. However, we cannot eliminate the risk of accidental contamination or discharge and any resultant injury from these materials. We do not currently maintain separate environmental liability coverage and any such contamination or discharge could result in significant cost to us in penalties, damages, and suspension of our operations.
Backlog
We run our operations on a just-in-time basis; however, the volatility of order intake may result in periods when incoming orders exceed our capacity. We do not currently have a backlog of orders that could not be fulfilled in our ordinary course of business. Further, our customers can change or cancel orders with limited or no penalty and limited advance notice prior to shipment.
Geographic information
During the years ended December 31, 2018, 2017, and 2016, substantially all of our long-lived assets were located within the United States. See Note 2 to our audited consolidated financial statements included elsewhere in this Annual Report on Form 10-K for additional information related to our U.S. and non-U.S. revenue.
Seasonality
We believe our sales may be impacted by seasonal factors. For example, we typically experience higher total sales in the second and third quarters, as a result of consumers traveling and vacationing during warmer weather in the spring and summer months, but this may vary year-over-year. As more home medical equipment (HME) providers adopt portable oxygen concentrators in their businesses, we expect our historical seasonality in the domestic business-to-business channel could change as well, which was previously influenced mainly by consumer buying patterns. Direct-to-consumer sales seasonality may also be impacted by the number of sales representatives and the amount of marketing spend in each quarter. For the years ended December 31, 2018, 2017 and 2016, the sales revenue in the second quarter accounted for 27.4%, 25.7% and 27.1%, respectively, and the sales revenue in the third quarter accounted for 26.7%, 28.0% and 28.1%, respectively, of our total sales revenue.
Corporate and available information
We were incorporated in Delaware in November 2001. Our principal executive offices are located at 326 Bollay Drive, Goleta, California 93117. Our telephone number is (805) 562-0500. Our website address is www.inogen.com. We make available on our website, free of charge, our Annual Report on Form 10-K, Quarterly Reports on Form 10-Q, Current Reports on Form 8-K, and any amendments to those reports, as soon as reasonably practicable after we electronically file such material with, or furnish it to, the Securities and Exchange Commission, or SEC. Our SEC reports can be accessed through the investor relations page of our website located at http://investor.inogen.com. The SEC also maintains a website that contains our SEC filings. The address of the site is www.sec.gov.
20
We webcast our earnings calls and certain events we participate in or host with members of the investment community on our investor relations page of our website. In addition, we use our website http://investor.inogen.com as a means of disclosing information about our company, our products, our planned financial and other announcements, our attendance at upcoming investor conferences, and other matters. It is possible that the information we post on our website could be deemed material information. We may use our website to comply with our disclosure obligations under Regulation FD. Therefore, investors should monitor our website in addition to following our press releases, SEC filings, public conference calls, and webcasts. Corporate governance information, including our board committee charters, code of ethics, and corporate governance principles, is also available on our investor relations page of our website located at http://investor.inogen.com. The contents of our website are not incorporated by reference into this Annual Report on Form 10-K or in any other report or document we file with the SEC, and any references to our website are intended to be inactive textual references only.
Executive officers of the registrant
The following table identifies certain information about our executive officers as of February 22, 2019.
|
Name |
|
Age |
|
Position |
|
Scott Wilkinson |
|
54 |
|
Chief Executive Officer, President, and Director |
|
Alison Bauerlein |
|
37 |
|
Executive Vice President, Finance and Chief Financial |
|
|
|
|
|
Officer, Corporate Secretary and Corporate Treasurer |
|
Bart Sanford |
|
53 |
|
Executive Vice President, Operations |
|
Brenton Taylor |
|
37 |
|
Executive Vice President, Engineering |
|
Byron Myers |
|
39 |
|
Executive Vice President, Sales and Marketing |
Scott Wilkinson has served as our President and Chief Executive Officer since March 1, 2017 and a director since January 1, 2017. Previously, Mr. Wilkinson served as our President and Chief Operating Officer from January 1, 2016 through February 28, 2017, Executive Vice President, Sales and Marketing from 2008 through December 31, 2015, and in this role oversaw Inogen’s global operations in sales, marketing, customer service, product management, medical billing, and clinical services. Prior to that, Mr. Wilkinson served as our Director of Product Management from 2005 to 2006 and Vice President, Product Management from 2006 to 2008. From 2000 to 2005, Mr. Wilkinson worked for Invacare Corporation, a designer and manufacturer of oxygen products, as a Group Product Manager and helped launch their $100 million oxygen product line segment. From 1999 to 2000, Mr. Wilkinson served as a Product Line Director with Johnson & Johnson, a healthcare company. From 1988 to 1999, Mr. Wilkinson worked as a Research Scientist, Product Manager, and Project Leader at Kimberly Clark, a consumer products company. Mr. Wilkinson received a Bachelor of Science degree in Chemical Engineering from the University of Akron and an MBA from University of Wisconsin, Oshkosh. The board of directors believes that Mr. Wilkinson’s considerable knowledge and understanding of our business together with his extensive industry experience qualifies him to serve on the board.
Alison Bauerlein is a co-founder of Inogen and has served as our Chief Financial Officer since 2009 and Executive Vice President, Finance since March 2014. Ms. Bauerlein has also served as Corporate Secretary and Corporate Treasurer since 2002. Ms. Bauerlein previously served as our Vice President, Finance from 2008 until March 2014. Prior to serving in these positions, Ms. Bauerlein also served as Controller with our company from 2008 to 2009 and 2001 to 2004, and the Director of Financial Planning and Analysis from 2004 to 2008. Ms. Bauerlein has over 15 years experience in treasury, finance, accounting, risk management as well as strategic and tactical cost analysis and forecasting. Ms. Bauerlein received a Bachelor of Arts degree in Economics/Mathematics with high honors from the University of California, Santa Barbara.
Bart Sanford has served as our Executive Vice President, Operations since September 2018. From April 2017 to September 2018, Mr. Sanford was Senior Vice President, Operations, at Cepheid Inc., a molecular diagnostics company. From October 2010 to March 2017, Mr. Sanford was Vice President, Global Operations, at Molecular Devices, LLC, a life sciences company. From January 2009 to September 2010, Mr. Sanford was a Corporate Director at Danaher Corporation, a medical device company. From March 2000 to December 2008, Mr. Sanford held various positions at Fluke Corporation, an industrial test product company, including plant manager, manufacturing manager and materials manager. Mr. Sanford received an MBA from Central Michigan University and a Bachelor of Arts degree in Logistics, Materials and Supply Chain Management from Michigan State University.
Brenton Taylor is a co-founder of Inogen and has served as our Executive Vice President, Engineering since March 2014. Prior to serving in this position, Mr. Taylor served as our Vice President, Engineering from 2008 until March 2014 and as the Director of Technology with our company from 2003 to 2008. Mr. Taylor is listed as an inventor on 28 of the Company’s issued patents related to portable oxygen concentrator development. Mr. Taylor received a Bachelor of Science degree in Microbiology from the University of California, Santa Barbara.
21
Byron Myers is a co-founder of Inogen and has served as our Executive Vice President, Sales and Marketing since January 1, 2017. Previously, Mr. Myers served as our Vice President, Marketing from 2011 to 2016. In his current role, Mr. Myers leads Inogen’s sales, marketing and product management operations. Prior to serving in these positions, Mr. Myers held various roles with our company, including: Product Manager from 2002 to 2006, Director of Marketing from 2006 to 2007 and 2008 to 2011, International Product Manager during 2007, and Director of International Product Management from 2007 to 2008. Mr. Myers received a Bachelor of Arts degree in Economics/Mathematics from the University of California, Santa Barbara and an MBA from the Rady School of Management at the University of California, San Diego.
We operate in a rapidly changing environment that involves numerous uncertainties and risks. In addition to the other information included in this Annual Report on Form 10-K, the following risks and uncertainties may have a material and adverse effect on our business, financial condition, results of operations, or stock price. You should consider these risks and uncertainties carefully, together with all of the other information included or incorporated by reference in this Annual Report on Form 10-K. The risks and uncertainties described below may not be the only ones we face. If any of the risks or uncertainties we face were to occur, the trading price of our securities could decline, and you may lose all or part of your investment. This Annual Report on Form 10-K also contains forward-looking statements that involve risks and uncertainties. Our actual results could differ materially from those anticipated in the forward-looking statements as a result of factors that are described below and elsewhere in this report.
Risks related to our business and strategy
We face intense international, national, regional and local competition and if we are unable to compete successfully, it could have an adverse effect on our revenue, revenue growth rate, if any, and market share.
The long-term oxygen therapy market is a highly competitive industry. We compete with a number of manufacturers and distributors of portable oxygen concentrators, as well as providers of other long-term oxygen therapy solutions such as home delivery of oxygen tanks or cylinders, stationary concentrators, transfilling concentrators, and liquid oxygen.
Our significant manufacturing competitors are Respironics (a subsidiary of Koninklijke Philips N.V.), Invacare Corporation, Caire Medical (subsidiary of NGK Spark Plug), DeVilbiss Healthcare (a subsidiary of Drive Medical), O2 Concepts, Precision Medical, Resmed, and Gas Control Equipment (subsidiary of Colfax). Additional competitors have also pre-announced upcoming product launches of portable oxygen concentrators expected in 2019 including 3B Medical and SysMed. Given the relatively straightforward regulatory path in the oxygen therapy device manufacturing market, we expect that the industry will become increasingly competitive in the future. For example, some major competitors have implemented direct-to-consumer sales models which may increase their competitiveness and sales to patients, however these strategies are limited to direct-to-consumer sales and do not include direct-to-consumer rentals where they would be responsible to meet national accreditation and state-by-state licensing requirements and secure Medicare billing privileges. Manufacturing companies compete for sales to providers primarily on the basis of price, quality/reliability, financing, bundling, product features, and service.
For many years, Lincare, Inc. (a subsidiary of the Linde Group), Apria Healthcare, Inc., AdaptHealth (formerly QMES LLC), Aerocare Holdings, Inc. and Rotech Healthcare, Inc. have been among the market leaders in providing long-term oxygen therapy, while the remaining long-term oxygen therapy market is serviced by local providers. Because many long-term oxygen therapy providers may have difficulty providing service at the prevailing Medicare reimbursement rates, we expect more industry consolidation. Oxygen therapy providers compete primarily on the basis of product features and service, rather than price, since reimbursement levels are established by Medicare and Medicaid, or by the individual determinations of private payors.
Some of our competitors are large, well-capitalized companies with greater resources than we have. As a consequence, they are able to spend more aggressively on product development, marketing, sales and other product initiatives than we can. Some of these competitors have:
|
|
• |
significantly greater name recognition; |
|
|
• |
established relationships with healthcare professionals, customers and third-party payors; |
|
|
• |
established distribution networks; |
|
|
• |
additional lines of products, and the ability to offer rebates or bundle products to offer higher discounts, lower pricing, longer warranties, financing or extended terms, other incentives to gain a competitive advantage; |
22
|
|
• |
greater history in conducting research and development, manufacturing, marketing and obtaining regulatory approval for oxygen device products; and |
|
|
• |
greater financial and human resources for product development, sales and marketing, and patent litigation. |
As a result, our competitors may be able to respond more quickly and effectively than we can due to new or changing opportunities, technologies, standard regulatory and reimbursement development and customer requirements. In light of these advantages that our competitors maintain, even if our technology and direct-to-consumer distribution strategy is more effective than the technology and distribution strategy of our competitors, including those who have adopted or may in the future adopt direct-to-consumer sales models, current or potential customers might accept competitor products and services in lieu of purchasing our products. We anticipate that we will face increased competition in the future as existing companies and competitors develop new or improved products and distribution strategies and as new companies enter the market with new technologies and distribution strategies. We may not be able to compete effectively against these organizations. Our ability to compete successfully and to increase our market share is dependent upon our reputation for providing responsive, professional and high-quality products and services and achieving strong customer satisfaction. Increased competition in the future could adversely affect our revenue, revenue growth rate, margins and market share.
If we are unable to continue to enhance our existing products and develop and market new products that respond to customer needs and preferences and achieve market acceptance, we may experience a decrease in demand for our products and our business could suffer.
We may not be able to compete as effectively with our competitors, and ultimately satisfy the needs and preferences of our customers, unless we can continue to enhance existing products and develop new innovative products. Product development requires significant financial, technological and other resources. While we expended $7.0 million, $5.3 million and $5.1 million for the years ended December 31, 2018, 2017, and 2016, respectively, for research and development efforts, we cannot assure that this level of investment will be sufficient to maintain a competitive advantage in product innovation, which could cause our business to suffer. Product improvements and new product introductions also require significant planning, design, development, patent protection, and testing at the technological, product, and manufacturing process levels and we may not be able to timely develop product improvements or new products or obtain necessary patent protection and regulatory clearances or approvals for such product improvements or new products in a timely manner, or at all. Our competitors’ new products may enter the market before our new products reach market, be more effective with more features, obtain better market acceptance, or render our products obsolete. Any new products that we develop may not receive market acceptance or otherwise generate any meaningful sales or profits for us relative to our expectations based on, among other things, existing and anticipated investments in manufacturing capacity and commitments to fund advertising, marketing, promotional programs and research and development.
We depend on a limited number of customers for a significant portion of our sales revenue and the loss of, or a significant shortfall in demand from, these customers could have a material adverse effect on our financial condition and results of operations.
We receive a significant amount of our sales revenue from a limited number of customers, including distributors, HME oxygen providers, our private label partner and resellers. For the years ended December 31, 2018, 2017, and 2016, sales revenue to our top 10 customers accounted for approximately 37.9%, 40.1% and 41.4%, respectively, of our total revenue. One customer represented more than 10% of our total revenue for the years ended December 31, 2018, 2017 and 2016. We expect that sales to relatively few customers will continue to account for a significant percentage of our total revenue in future periods. However, we can provide no assurance that any of these customers or any of our other customers will continue to purchase our products at current levels, pricing, or at all, and our revenue could fluctuate significantly due to changes in customer order levels, economic conditions, the adoption of competitive products, or the loss of, reduction of business with, or less favorable terms with any of our largest customers. Our future success will significantly depend upon the timing and volume of business from our largest customers and the financial and operational success of these customers. If we were to lose one of our key customers or have a key customer significantly reduce its volume of business with us, our revenue may be materially reduced and there would be an adverse effect on our business, financial condition and results of operations.
23
We obtain some of the components, subassemblies and completed products included in our Inogen One systems and our Inogen At Home from a single source or a limited group of manufacturers or suppliers, and the partial or complete loss of one or more of these manufacturers or suppliers could cause significant production delays, an inability to meet customer demand, substantial loss in revenue, and an adverse effect on our financial condition and results of operations.
We utilize single-source suppliers for some of the components and subassemblies we use in our Inogen One systems and our Inogen At Home systems. For example, we have elected to source certain key components from single sources of supply, including our batteries, motors, valves, and some molded plastic components. Our dependence on single-source suppliers of components may expose us to several risks, including, among other things:
|
|
• |
our suppliers may encounter financial hardships as a result of unfavorable economic and market conditions unrelated to our demand for components, which could inhibit their ability to fulfill our orders and meet our requirements; |
|
|
• |
suppliers may fail to comply with regulatory requirements, be subject to lengthy compliance, validation or qualification periods, or make errors in manufacturing components that could negatively affect the performance or safety of our products or cause delays in supplying of our products to our customers; |
|
|
• |
newly identified suppliers may not qualify under the stringent quality regulatory standards to which our business is subject, which could inhibit their ability to fulfill our orders and meet our requirements; |
|
|
• |
we or our suppliers may not be able to respond to unanticipated changes in customer orders, and if orders do not match forecasts, we or our suppliers may have excess or inadequate inventory of materials and components; |
|
|
• |
we may be subject to price fluctuations due to a lack of long-term supply arrangements for key components or changes in import tariffs; |
|
|
• |
we may experience delays in delivery by our suppliers due to customs clearing delays, shipping delays, scarcity of raw materials or changes in demand from us or their other customers; |
|
|
• |
we or our suppliers may lose access to critical services and components, resulting in an interruption in the manufacture, assembly and shipment of our systems; |
|
|
• |
our suppliers may be subject to allegations by other parties of misappropriation of proprietary information in connection with their supply of products to us, which could inhibit their ability to fulfill our orders and meet our requirements; |
|
|
• |
fluctuations in demand for products that our suppliers manufacture for others may affect their ability or willingness to deliver components to us in a timely manner; |
|
|
• |
our suppliers may wish to discontinue supplying components or services to us; and |
|
|
• |
we may not be able to find new or alternative components or reconfigure our system and manufacturing processes in a timely manner if the necessary components become unavailable. |
We have in the past experienced supply problems with some of our suppliers and may again experience problems in the future. For example, we have previously had issues with our suppliers sourcing certain components of our Inogen One products. If we had not been able to obtain sufficient quantities of the required component, we would have been required to delay manufacturing until additional supplies become available, or we would have been required to validate an alternative component. We may not be able to quickly establish additional or replacement suppliers, particularly for our single source components or subassemblies. Any interruption or delay in the supply of components or subassemblies, or our inability to obtain components or subassemblies from alternate sources at acceptable prices in a timely manner, could impair our ability to meet the demand of our customers and cause them to cancel orders or switch to competitive products.
In addition, we may be deemed to manufacture or contract to manufacture products that contain certain minerals that have been designated as “conflict minerals” under the Dodd-Frank Wall Street Reform and Consumer Protection Act. As a result, we may be required to perform due diligence to determine the origin of such minerals and disclose and report whether or not such minerals originated in the Democratic Republic of the Congo or adjoining countries. The implementation of these requirements could adversely affect the sourcing, availability, and pricing of minerals used in the manufacture of our products. In addition, we have incurred additional costs to comply with the disclosure requirements, including costs related to determining the source of any of the relevant minerals and metals used in our products. If any of these risks materialize, costs could significantly increase and our ability to meet demand for our products could be impacted. If we fail to comply with the applicable regulations, we could be required to pay civil penalties, face criminal prosecution and, in some cases, be prohibited from distributing our products in commerce until the products or component substances are brought into compliance. If we are unable to satisfy commercial demand for our Inogen One systems and Inogen At Home systems in a timely manner, our ability to generate revenue would be impaired, market acceptance of our products could be adversely affected, and customers may instead purchase or use alternative products. In addition, we could be forced to secure
24
new or alternative components and subassemblies through a replacement supplier. Finding alternative sources for these components and subassemblies could be difficult in certain cases and may entail a significant amount of time and disruption. In some cases, we would need to change the components or subassemblies if we sourced them from an alternative supplier. This, in turn, could require a redesign of our Inogen One systems and Inogen At Home systems and, potentially, require additional Food and Drug Administration (FDA) clearance or approval before we could use any redesigned product with new components or subassemblies, thereby causing further costs and delays that could adversely affect our business, financial condition and results of operations.
A significant majority of our rental patients who use our product have health coverage under the Medicare program, and recently enacted and future changes in the reimbursement rates or payment methodologies under Medicare, Medicaid and other government programs have affected and could continue to materially and adversely affect our business and operating results.
As a provider of oxygen rentals, we depend heavily on Medicare reimbursement as a result of the higher proportion of elderly persons suffering from chronic long-term respiratory conditions. Medicare Part B, or Supplementary Medical Insurance Benefits, provides coverage to eligible beneficiaries that include items of durable medical equipment for use in the home, such as oxygen equipment and other respiratory devices. We believe that approximately 60% of long-term oxygen therapy patients in the United States have primary coverage under Medicare Part B excluding Medicare Advantage plans. There are increasing pressures on Medicare to control healthcare costs and to reduce or limit reimbursement rates for home medical products.
Legislation, including the Medicare Prescription Drug, Improvement, and Modernization Act of 2003, the Deficit Reduction Act of 2005, the Medicare Improvements for Patients and Providers Act of 2008, the Patient Protection and Affordable Care Act, as amended by the Health Care and Education Reconciliation Act, and the 21st Century Cures Act (Cures Act) contain provisions that directly impact reimbursement for the durable medical equipment products provided by us:
|
|
• |
The Medicare Prescription Drug, Improvement, and Modernization Act of 2003 significantly reduced reimbursement for inhalation drug therapies beginning in 2005, reduced payment amounts for certain durable medical equipment, including oxygen, beginning in 2005, froze payment amounts for other covered home medical equipment items through 2008, established a competitive bidding program for home medical equipment and implemented quality standards and accreditation requirements for durable medical equipment suppliers. |
|
|
• |
The Deficit Reduction Act of 2005 limited the total number of continuous rental months for which Medicare will pay for oxygen equipment to 36 months, after which time there is generally no additional reimbursement to the supplier (other than for periodic, in-home maintenance and servicing). The Deficit Reduction Act of 2005 also provided that title of the equipment would transfer to the beneficiary, which was later repealed by the Medicare Improvements for Patients and Providers Act of 2008. For purposes of the rental cap, the Deficit Reduction Act of 2005 provided for a new 36-month rental period that began January 1, 2006 for all oxygen equipment. After the 36th continuous month during which payment is made for the oxygen equipment, the supplier is generally required to continue to furnish the equipment during the period of medical need for the remainder of the useful lifetime of the equipment, provided there are no breaks in service due to medical necessity that exceed 60 days. The reasonable useful lifetime for our portable oxygen equipment is 60 months. After 60 months, if the patient requests, and the patient meets Medicare coverage criteria, the rental cycle starts over and a new 36-month rental period begins. There are no limits on the number of 60-month cycles over which a Medicare patient may receive benefits and an oxygen therapy provider may receive reimbursement, so long as such equipment continues to be medically necessary for the patient. We anticipate that the Deficit Reduction Act of 2005 oxygen payment rules will continue to negatively affect our net revenue on an ongoing basis, as each month additional customers reach the capped rental period in month thirty-seven, resulting in potentially two or more years without rental income from these customers while we continue to incur customer service and maintenance costs. Our capped patients as a percentage of total patients on service was approximately 19.1% as of December 31, 2018, which is higher than the capped patients as a percentage of total patients on service of approximately 17.0% as of December 31, 2017. The percentage of capped patients may fluctuate over time as new patients come on service, patients come off of service before and during the capped rental period, and existing patients enter the capped rental period. We cannot predict the potential impact to rental revenues in future periods associated with patients in the capped rental period. |
|
|
• |
The Patient Protection and Affordable Care Act, as amended by the Health Care and Education Reconciliation Act, includes, among other things, new face-to-face physician encounter requirements for certain durable medical equipment and home health services, and a requirement that by 2016, the competitive bidding process must be nationalized or prices in non-competitive bidding areas must be adjusted to match competitive bidding prices. As of January 1, 2017, CMS has decreased prices for durable medical equipment in non-competitive bidding areas to match competitive bidding prices. |
25
These legislative provisions as currently in effect have had and may continue to have a material and/or adverse effect on our business, financial condition and results of operations.
The Health and Human Services (HHS) Office of Inspector General (OIG) has recommended states to review Medicaid reimbursement for durable medical equipment (DME) and supplies. The OIG cites an earlier report estimating that four states (California, Minnesota, New York, and Ohio) could have saved more than $18.1 million on selected DME items if their Medicaid prices were comparable to those under round one of the Medicare competitive bidding program. Since issuing those reports, the OIG identified $12 million in additional savings that the four states could have obtained on the selected items by using pricing similar to the Medicare round two competitive bidding and national mail-order programs. In light of varying Medicaid provider rates for DME and the potential for lower spending, the OIG recommends that CMS (1) seek legislative authority to limit state Medicaid DME reimbursement rates to Medicare program rates, and (2) encourage further reduction of Medicaid reimbursement rates through competitive bidding or manufacturer rebates (the OIG did not determine the cost of implementing a rebate or competitive bidding program in each state). This was effective beginning January 1, 2018.
On January 28, 2016, the Department of Health and Human Services (DHHS) published a final rule to implement Medicare’s face-to-face provisions for home health and DME under the Medicaid program, effective July 1, 2016. Medicaid programs are run by state agencies that must coordinate with state legislative bodies, therefore the state agencies have until July 1, 2017 or July 1, 2018 (depending on the timing of their legislative sessions) to allow state agencies to publish compliant initiatives on this rule. All states except Montana, Nevada, North Dakota, and Texas were expected to initiate this requirement effective July 1, 2017. Montana, Nevada, North Dakota, and Texas were expected to implement the requirements by July 1, 2018. The Medicaid definition of medical supplies, equipment and appliances were aligned with the Medicare definitions. In addition, the DHHS has implemented the requirement for a face-to-face visit related to the beneficiary’s primary need for medical equipment within 6 months prior to the start of certain durable medical equipment services, including oxygen. These legislative provisions could have an adverse effect on our business, financial condition and results of operations.
Due to budgetary shortfalls, many states are considering, or have enacted, cuts to their Medicaid programs. In addition, many private payors bill at a percentage of the Medicare rates. Medicare, Medicaid and private payor reimbursement rate cuts have included, or may include, elimination or reduction of coverage for our products, amounts eligible for payment under co-insurance arrangements, or payment rates for covered items. Continued state budgetary pressures could lead to further reductions in funding for the reimbursement for our products which, in turn, would adversely affect our business, financial condition and results of operations.
On January 17, 2017, the U.S. Department of Health and Human Services published a final rule effective March 20, 2017 to address the appeals backlog that includes allowing certain decisions to be made by the Medicare Appeals Council to set precedent for lower levels of appeal, expansion of the pool of available adjudicators, and increasing decision-making consistency among the levels of appeal. In addition, it included provisions to improve the efficiency by streamlining the appeals process, allowing attorneys to handle some procedural matters at the administrative law judge level, and proposed funding increases and legislative actions outlined in the federal budget for 2017. DHHS estimates this could eliminate the backlog in appeals by 2021. However, if this plan is not effective, the appeals backlog could increase, which could increase our collection times and decrease our cash flow, increase billing administrative costs, and/or increase the provision for rental revenue adjustments, which would adversely affect our business, financial condition and results of operations.
The competitive bidding process under Medicare could negatively affect our business and financial condition.
The Medicare Prescription Drug, Improvement, and Modernization Act of 2003 requires the Secretary of Health and Human Services to establish and implement programs under which competitive acquisition areas are established throughout the United States for purposes of awarding contracts for the furnishing of competitively priced items of durable medical equipment, including oxygen equipment.
26
Effective January 1, 2019, Medicare beneficiaries may receive durable medical equipment from any Medicare-enrolled supplier until new contracts are in effect under the next round of competitive bidding, which is not expected until January 1, 2021. Reimbursement rates between January 1, 2019 and December 31, 2020 will be set at the current pricing level throughout the United States for all Medicare patients, subject to Consumer Price Index (CPI) and budget neutrality adjustments. Pricing in competitive bidding areas will be subject to annual CPI adjustments beginning in 2019 until the next bidding round takes place. However, CMS also changed the calculation on budget neutrality to apply the offset to all oxygen and oxygen equipment classes beginning January 1, 2019 instead of previously only applying these adjustments to stationary oxygen equipment and oxygen contents. Based on these CPI and budget neutrality adjustments, effective January 1, 2019, the average Medicare rates were reduced to $72.92 a month for E1390 and $35.72 a month for E1392 in these regions that were previously subject to competitive bidding. Medicare also established new payment classes for liquid oxygen equipment and high flow portable liquid oxygen contents effective January 1, 2019.
In the next round of DMEPOS competitive bidding program, there have been some revisions to the bidding methodology including the plan to implement surety bond requirements, lead item pricing, and setting reimbursement rates at the maximum winning bid rate instead of the median winning bid rate. It is unclear how this will impact pricing at that time. We expect additional clarity on the next round of competitive bidding in 2019.
In addition to regional pricing, CMS imposed different pricing on “frontier states” and rural areas. CMS defines frontier states as states where more than 50% of the counties in the state have a population density of 6 people or less per square mile and rural states are defined as states where more than 50% of the population lives in rural areas per census data. Current frontier states include MT, ND, SD and WY; rural states include ME, MS, VT and WV; and non-contiguous United States areas include AK, HI, Guam and Puerto Rico. Effective June 1, 2018 through December 31, 2020, for frontier and rural states, frontier and rural zip codes in non-frontier/rural states and non-contiguous United States areas, the single payment amount will be the 50/50 blended reimbursement rates based on an average of the pre-competitive reimbursement bidding rates and the current average reimbursement rates to account for higher servicing costs in these areas. We estimate that less than 10% of our patients would be eligible to receive the higher reimbursement rates based on the geographic locations of our current patient population.
Cumulatively in previous rounds of competitive bidding, we were offered contracts for a substantial majority of the CBAs and product categories for which we submitted bids. Effective January 1, 2017, we believe we had access to over 85% of the Medicare oxygen therapy market based on our analysis of the 103 CBAs that we won out of the 130 total CBAs. These 130 CBAs represent approximately 59% of the market with the remaining approximately 41% of the market not subject to competitive bidding. As of January 1, 2019, we can now choose to accept Medicare oxygen patients throughout the United States. As of July 2018, we currently operate in all 50 states in the U.S. We did not sell or rent to patients in Hawaii due to the licensure requirements from inception to June 2018.
We cannot guarantee that we will be offered contracts in subsequent rounds of competitive bidding. In all five rounds of competitive bidding in which we have participated, we have gained access to certain CBAs and been excluded from other CBAs.
Medicare revenue, including patient co-insurance and deductible obligations, represented 4.8% of our total revenue in the year ended December 31, 2018.
Medicare reimbursement for oxygen rental equipment is limited to a maximum of 36 months within a 60-month service period, and the equipment remains the property of the home oxygen supplier. The supplier that billed Medicare for the 36th month of service continues to be responsible for the patient’s oxygen therapy needs for months 37 through 60, and there is generally no additional reimbursement for oxygen generating portable equipment for these later months. CMS does not separately reimburse suppliers for oxygen tubing, cannulas and supplies that may be required for the patient. The supplier is required to keep the equipment provided in working order and in some cases, CMS will reimburse for repair costs. At the end of the five-year useful life of the equipment, the patient may request replacement equipment and, if he or she can be re-qualified for the Medicare benefit, a new maximum 36-month payment cycle out of the next 60 months of service would begin. The supplier may not arbitrarily issue new equipment. We have analyzed the potential impact to revenue associated with patients in the capped rental period and have deferred $0 associated with the capped rental period as of December 31, 2018 and December 31, 2017. Our capped patients as a percentage of total patients on service was approximately 19.1% as of December 31, 2018, which is higher than the capped patients as a percentage of total patients on service of approximately 17.0% as of December 31, 2017. The percentage of capped patients may fluctuate over time as new patients come on service, patients come off of service before and during the capped rental period, and existing patients enter the capped rental period.
27
Our obligations to service Medicare patients over the rental period include supplying working equipment that meets each patient’s oxygen needs pursuant to his/her doctor’s prescription and certificate of medical necessity form and supplying all disposables required for the patient to operate the equipment, including cannulas, filters, replacement batteries, carts and carry bags, as needed. If the equipment malfunctions, we must repair or replace the equipment. We determine what equipment the patient receives, as long as that equipment meets the physician’s prescription, and we can deploy used assets in working order as long as the prescription requirements are met. We must also procure a recertification of the certificate of medical necessity from the patient’s doctor to confirm the patient’s need for oxygen therapy one year after the patient first receives oxygen therapy and one year after each new 36-month reimbursement period begins. The patient can choose to receive oxygen supplies and services from another supplier at any time, but the supplier may only transition the patient to another supplier in certain circumstances.
On November 2, 2017, a bi-partisan bill was introduced in the House of Representatives that would provide relief from competitive bidding in non-bid areas. As of December 31, 2018, there were 158 co-sponsors on this bill. If passed, the bill would extend a retroactive delay of a second round of reimbursement cuts for Medicare beneficiaries from January 1, 2017 to January 1, 2019 based on the reimbursement rates effective on January 1, 2016. The legislation also proposes to remedy a double-dip cut to oxygen payments caused by the misapplication of a 2006 budget neutrality offset balancing increased utilization for oxygen generating portable equipment with lower reimbursement for stationary equipment.
On February 12, 2018, the current presidential administration sent Congress a 2019 budget proposal that included language on competitive bidding. Specifically, the proposal would eliminate the requirement under the competitive bidding program that CMS pay a single payment amount based on the median bid price, proposing instead that CMS pay winning suppliers at their own bid amounts. Additionally, this proposal would expand competitive bidding to all areas of the country, including rural areas, which will be based on competition in those areas rather than on competition in urban areas. This specific proposal is estimated to save the government $6.5 billion over 10 years. In addition to changes to competitive bidding, the 2019 budget proposal would enable CMS not to impose the face-to-face requirement on all providers for durable medical equipment. Furthermore, the proposal seeks to address excessive billing of durable medical equipment that requires refills or serial claims. Specifically, Medicare would gain authority to test whether using a benefits manager for serial durable medical equipment claims would result in lower improper payments and reductions in inappropriate utilization. The benefits manager would be responsible for ensuring beneficiaries were receiving the correct quantity of supplies or service for the appropriate time period. Lastly, the proposal would expand prior authorization to additional items and services that are both high-cost and at high-risk for improper payments. These provisions were not included in the latest omnibus budget, so it is unclear if any of these proposals will be implemented. We believe additional cuts to reimbursement would continue to drive conversion to non-delivery technologies, including POCs.
Although we continue to monitor developments regarding the implementation of the competitive bidding program, we cannot predict the outcome of the competitive bidding program on our business when fully implemented, nor the Medicare reimbursement rates that will be in effect in future years for the items subject to competitive bidding, including our products. We expect that the stationary oxygen and non-delivery ambulatory oxygen reimbursement rates will continue to fluctuate, and a large negative payment adjustment would adversely affect our business, financial condition and results of operations.
The Medicare Fee-For-Service (FFS) sequestration reduction has and may continue to negatively affect our revenue and profits.
Medicare FFS claims with dates of service on or after April 1, 2013 are subject to a 2% reduction in Medicare payment, including claims for DMEPOS, including in competitive bidding areas. The claims payment adjustment is applied to all claims after determining co-insurance, any applicable deductible, and any applicable Medicare secondary payment adjustments. These reductions are included in rental revenue adjustments. This sequestration reduction will continue until further notice. As a result, this could adversely affect our financial condition and results of operations.
Healthcare reform measures may have a material adverse effect on our business and results of operations.
In the United States, the legislative landscape, particularly as it relates to healthcare regulation and reimbursement coverage, continues to evolve. In March 2010, the Patient Protection and Affordable Care Act was passed, which has the potential to substantially change healthcare financing by both governmental and private insurers, and significantly impact the U.S. medical device industry.
28
In addition, other legislative changes have been proposed and adopted in the United States since the Patient Protection and Affordable Care Act was enacted. On August 2, 2011, the Budget Control Act of 2011 created, among other things, measures for spending reductions by Congress. A Joint Select Committee on Deficit Reduction, tasked with recommending a targeted deficit reduction of at least $1.2 trillion for the years 2013 through 2021, was unable to reach required goals, thereby triggering the legislation’s automatic reduction to several government programs. This includes aggregate reductions of Medicare reimbursements to providers up to 2% per fiscal year, which went into effect on April 1, 2013, and will remain in effect through 2024 unless additional Congressional action is taken. We expect that additional state and federal healthcare reform measures will be adopted in the future, any of which could limit the amounts that federal and state governments will pay for healthcare products and services, which could result in reduced demand for our products or additional pricing pressures.
In addition to the legislative changes discussed above, the Patient Protection and Affordable Care Act also requires healthcare providers to voluntarily report and return an identified overpayment within 60 days after identifying the overpayment. Failure to repay the overpayment within 60 days will result in the claim being considered a “false claim” and the healthcare provider will be subject to False Claims Act liability.
State legislative bodies also have the right to enact legislation that would impact requirements of home medical equipment providers, including oxygen therapy providers. Some states have already enacted legislation that would require in-state facilities. We are monitoring all state requirements to maintain compliance with state-specific legislation and access to service patients in these states. To the extent such legislation is enacted, it could result in increased administrative costs or otherwise exclude us from doing business in a particular state, which would adversely impact our business, financial condition and results of operations.
We face uncertainties that might result from modification or repeal of any of the provisions of the Patient Protection and Affordable Care Act, including as a result of current and future executive orders and legislative actions. The impact of those changes on us and potential effect on the durable medical equipment industry as a whole is currently unknown. But, any changes to the Patient Protection and Affordable Care Act are likely to have an impact on our results of operations and may have a material adverse effect on our results of operations. We cannot predict what other healthcare programs and regulations will ultimately be implemented at the federal or state level or the effect of any future legislation or regulation in the United States may have on our business.
We depend upon reimbursement from Medicare, private payors, Medicaid and payments from patients for a significant portion of our revenue, and if we fail to manage the complex and lengthy reimbursement process, our business and operating results could be adversely affected.
A significant portion of our rental revenue is derived from reimbursement by third-party payors. We accept assignment of insurance benefits from customers and, in a majority of cases, invoice and collect payments directly from Medicare, private payors and Medicaid, as well as direct from patients under co-insurance provisions. For the years ended December 31, 2018, 2017 and 2016, approximately 6.2%, 9.6% and 17.1%, respectively, of our total revenue was derived from Medicare, private payors, Medicaid, and individual patients who directly receive reimbursement from third-party payors.
Our financial condition and results of operations may be affected by the healthcare industry’s reimbursement process, which is complex and can involve lengthy delays between the time that a product is delivered to the consumer and the time that the reimbursement amounts are settled. Depending on the payor, we may be required to obtain certain payor-specific documentation from physicians and other healthcare providers before submitting claims for reimbursement. Certain payors have filing deadlines and they will not pay claims submitted after such time. We are also subject to extensive pre-payment and post-payment audits by governmental and private payors that could result in material delays, refunds of monies received or denials of claims submitted for payment under such third-party payor programs and contracts. We cannot ensure that we will be able to continue to effectively manage the reimbursement process and collect payments for our products promptly. If we fail to manage the complex and lengthy reimbursement process, it would adversely affect our business, financial condition and results of operations.
29
Failure to maintain or obtain new private payor contracts and future reductions in reimbursement rates from private payors could have a material adverse effect on our financial condition and results of operations.
A portion of our rental revenue is derived from private payors. Based on our patient population, we estimate approximately 40% of potential customers have non-Medicare insurance coverage (including Medicare Advantage plans). Failing to maintain and obtain private payor contracts from private insurance companies and employers and secure in-network provider status could have a material adverse effect on our financial condition and results of operations. In addition, private payors are under pressure to increase profitability and reduce costs. In response, certain private payors are limiting coverage or reducing reimbursement rates for the products we provide. We believe that private payor reimbursement levels will generally be reset in accordance with the Medicare reimbursement amounts determined by competitive bidding. We cannot predict the extent to which reimbursement for our products will be affected by competitive bidding or by initiatives to reduce costs for private payors. Failure to maintain or obtain new private payor contracts or the unavailability of third-party coverage or inadequacy of reimbursement for our products would adversely affect our business, financial condition and results of operations.
We do not have long-term supply contracts with many of our third-party suppliers.
We purchase components and subassemblies from third-party suppliers, including some of our single-source suppliers, through purchase orders and do not have long-term supply contracts with many of these third-party suppliers. Many of our third-party suppliers, therefore, are not obligated to perform services or supply products to us for any specific period, in any specific quantity or at any specific price, except as may be provided in a particular purchase order. We do not maintain large volumes of inventory from most of these suppliers. If we inaccurately forecast demand or fail to place orders timely enough relative to fluctuating lead time requirements for components or subassemblies, our ability to manufacture and commercialize our Inogen One systems and Inogen At Home systems could be delayed and our competitive position and reputation could be harmed. In addition, if we fail to effectively manage our relationships with these suppliers, we may be required to change suppliers which would be time consuming and disruptive and could adversely affect our business, financial condition and results of operations.
If our manufacturing facilities become unavailable or inoperable, we could be unable to continue manufacturing our Inogen One systems and Inogen At Home systems and, as a result, our business, financial condition and results of operations could be adversely affected until we are able to secure a new facility.
We assemble our Inogen One concentrators and Inogen At Home concentrators at our facilities in Richardson, Texas and Goleta, California and through our contract manufacturer in the Czech Republic. In the fourth quarter of 2017, we began using a contract manufacturer in the Czech Republic to assemble our Inogen One G3 concentrators for our international customers. No other manufacturing facilities are currently available to us, particularly facilities of the size and scope of our Texas facility. Our facilities and the equipment we use to manufacture our Inogen One systems and Inogen At Home systems would be costly to replace and could require substantial lead time to procure, repair or replace. Our facilities may be harmed or rendered inoperable by natural or man-made disasters, including, but not limited to, fire, flood, earthquakes and power outages, which may render it difficult or impossible for us to manufacture our products for some period of time. If any of our facilities become unavailable to us, we cannot provide assurances that we will be able to secure and equip a new manufacturing facility on acceptable terms, in a timely manner. The inability to manufacture our products, combined with delays in replacing parts inventory and manufacturing supplies and equipment, may result in the loss of customers and/or harm our reputation, and we may be unable to reestablish relationships with those customers in the future. Although we have insurance coverage for certain types of disasters and business interruptions which may help us recover some of the costs of damage to our property, costs of recovery and lost income from the disruption of our business, insurance coverage of certain perils may be limited or unavailable at cost effective rates and may therefore not be sufficient to cover any or all of our potential losses and may not continue to be available to us on acceptable terms, or at all. If our manufacturing capabilities are impaired, we could not be able to manufacture, store, and ship our products in sufficient quantity or a cost effective or timely manner, which would adversely affect our business, financial condition and results of operations.
We rely upon a third-party contract manufacturer for certain manufacturing operations and our business and results of operations may be adversely affected by risks associated with their business, financial condition and the geography in which they operate.
Beginning in the fourth quarter of 2017, we began utilizing a third-party contract manufacturer located in the Czech Republic for production of a portion of our Inogen One G3 concentrators. In 2018, our contract manufacturer produced the vast majority of the Inogen One G3 concentrators required to support our European demand and we expect this to continue in 2019. There are a number of risks associated with our dependence on a contract manufacturer, including:
|
|
• |
reduced control over delivery schedules and planning; |
|
|
• |
reliance on the quality assurance procedures of a third party; |
30
|
|
• |
risks associated with our contract manufacturer’s ability to successfully undergo FDA and other regulatory authority quality inspections; |
|
|
• |
potential uncertainty regarding manufacturing yields and costs; |
|
|
• |
availability of manufacturing capability and capacity, particularly during periods of high demand; |
|
|
• |
risks and uncertainties associated with the location or country where our products are manufactured, including potential manufacturing disruptions caused by social, geopolitical or environmental factors; |
|
|
• |
changes in U.S. law or policy governing foreign trade, manufacturing, development and investment in the countries where we manufacture our products, including the World Trade Organization Information Technology Agreement or other free trade agreements; |
|
|
• |
delays in delivery by suppliers due to customs clearing delays, shipping delays, scarcity of raw materials and changes in demand from us or their other customers; |
|
|
• |
limited warranties provided to us; and |
|
|
• |
potential misappropriation of our intellectual property. |
These and other risks could impair our ability to fulfill orders, harm our sales and impact our reputation with customers. If our contract manufacturer is unable or unwilling to manufacture our products or components of our products, or if our contract manufacturer discontinues operations, we may be required to identify and qualify alternative manufacturers, which could cause us to be unable to meet our supply requirements to our customers and result in the breach of our customer agreements. The process of qualifying a new contract manufacturer and commencing volume production is expensive and time-consuming, and if we are required to change or qualify a new contract manufacturer, we would likely lose sales revenue and damage our existing customer relationships.
If we are unable to manage our anticipated growth effectively, our business could be harmed.
The rapid growth of our business has placed a significant strain on our managerial and operational resources and systems. To execute our anticipated growth successfully, we must continue to attract and retain capable personnel and manage and train them effectively, particularly related to sales representatives and supporting sales personnel. We must also upgrade our internal business processes and capabilities to create the scalability that a growing business demands.
We plan to continue the expansion of our facilities located in Richardson, Texas and Cleveland, Ohio. Domestic expansion, combined with our use of a contract manufacturer in Europe to produce a portion of our Inogen One G3 concentrators, is expected to be sufficient to meet our manufacturing needs. However, our anticipated growth will place additional strain on our supply chain and manufacturing facilities, resulting in an increased need for us to carefully monitor parts inventory, capable staffing and quality assurance. Any failure by us to manage the scalability of our process or other aspects of our growth effectively could have an adverse effect on our ability to achieve our development and commercialization goals and negatively affect our financial condition and results of operations.
We may expand through acquisitions of, or investments in, other companies, each of which may divert our management’s attention, result in additional dilution to our stockholders, increase expenses, disrupt our operations, and harm our results of operations.
Our business strategy may, from time to time, include acquiring or investing in complementary services, technologies or businesses, such as our acquisition of MedSupport Systems B.V. in 2017. We cannot assure you that we will successfully identify suitable acquisition candidates, integrate or manage disparate technologies, lines of business, personnel and corporate cultures, realize our business strategy or the expected return on our investment, or manage a geographically dispersed company. Any such acquisition or investment could materially and adversely affect our financial condition and results of operations. The acquisition and integration process is complex, expensive and time-consuming, and may cause an interruption of, or loss of momentum in, product development and sales activities and operations of both companies, and we may incur substantial cost and expense, as well as divert the attention of management. We may issue equity securities which could dilute current stockholders’ ownership, incur debt, assume contingent or other liabilities and expend cash in acquisitions, which could negatively impact our financial condition, stockholder equity, and stock price.
31
Acquisitions and other strategic investments involve significant risks and uncertainties, including:
|
|
• |
the potential failure to achieve the expected benefits of the combination or acquisition; |
|
|
• |
unanticipated costs and liabilities; |
|
|
• |
difficulties in integrating new products, businesses, operations, and technology infrastructure in an efficient and effective manner; |
|
|
• |
difficulties in maintaining customer relations; |
|
|
• |
the potential loss of key employees of the acquired businesses; |
|
|
• |
the diversion of the attention of our senior management from the operation of our daily business; |
|
|
• |
the potential adverse effect on our cash position to the extent that we use cash for the purchase price; |
|
|
• |
the potential incurrence of interest expense and debt service requirements if we incur debt to pay for an acquisition; |
|
|
• |
the potential issuance of securities that would dilute our stockholders’ percentage ownership; |
|
|
• |
the potential to incur large and immediate write-offs and restructuring and other related expenses; and |
|
|
• |
the inability to maintain uniform standards, controls, policies, and procedures. |
Any acquisition or investment could expose us to unknown liabilities. Moreover, we cannot assure you that we will realize the anticipated benefits of any acquisition or investment. In addition, our inability to successfully operate and integrate newly acquired businesses appropriately, effectively, and in a timely manner could impair our ability to take advantage of future growth opportunities and other advances in technology, as well as on our revenues, gross margins, and expenses.
We may experience manufacturing problems or delays that could limit our growth or adversely affect our operating results.
Our Inogen One systems and Inogen At Home systems are manufactured using complex parts and processes, sophisticated equipment and strict adherence to design specifications and quality standards. Any unforeseen manufacturing problems, such as contamination of our facility, equipment malfunction or miscalibration, supply chain shortages, regulatory findings, or failure to strictly follow procedures or meet design specifications, could result in delays or shortfalls in production of our products. Identifying and resolving the cause of any such manufacturing issues could require substantial time and resources. If we are unable to keep up with demand for our products by successfully manufacturing and shipping our products in a timely and quality manner, our operating results could be impaired, market acceptance for our products could be adversely affected and our customers might instead purchase our competitors’ products.
In addition, the introduction of new products may require the development of new manufacturing processes and procedures. While all of our products are assembled using essentially the same basic processes, significant changes in technology, programming, and other variations may be required to meet product specifications. Developing new processes can be very time consuming and affect quality, as such any unexpected difficulty in doing so could delay the introduction of a new product and our ability to produce sufficient quantities of existing products.
We are exposed to the credit and non-payment risk of our HME providers, distributors, private label partners and resellers, especially during times of economic uncertainty and tight credit markets, which could result in material losses.
We make sales to certain HME providers, distributors, private label partner and resellers on unsecured credit, with terms that vary depending upon the customer’s credit history, solvency, cash flow, credit limits and sales history, as well as prevailing terms with similarly situated customers and whether sufficient credit insurance can be obtained. Challenging economic conditions may impair the ability of our customers to pay for products they have purchased, and as a result, our reserves for doubtful accounts and write-off of accounts receivable could increase and, even if increased, may turn out to be insufficient. Moreover, even in cases where we have insolvency risk insurance to protect against a customer’s bankruptcy, insolvency or liquidation, this insurance typically contains a significant deductible and co-payment obligation and does not cover all instances of non-payment. Our exposure to credit risks of our business partners may increase if our business partners and their end customers are adversely affected by global or regional economic conditions. One or more of these business partners could delay payments or default on credit extended to them, either of which could adversely affect our business, financial condition and results of operations.
32
We generate a substantial portion of our revenue internationally and are subject to various risks relating to such international activities, which could adversely affect our operating results. In addition, any disruption or delay in the shipping of our products, whether domestically or internationally, may have an adverse effect on our financial condition and results of operations.
During the years ended December 31, 2018, 2017 and 2016, approximately 21.6%, 22.3% and 24.7%, respectively, of our total revenue was generated from customers located outside of the United States. We believe that a significant percentage of our future revenue will continue to come from international sources as we expand our international operations and develop opportunities in other countries. Engaging in international business inherently involves a number of difficulties and risks, including:
|
|
• |
required compliance with anti-bribery laws, such as the U.S. Foreign Corrupt Practices Act and U.K. Bribery Act, data privacy regulations, such as the European Union General Data Protection Regulation (GDPR), labor laws, and anti-competition regulations; |
|
|
• |
export or import delays and restrictions; |
|
|
• |
obtaining and maintaining regulatory clearances, approvals and certifications; |
|
|
• |
laws and business practices favoring local companies; |
|
|
• |
difficulties in enforcing agreements and collecting receivables through certain foreign legal systems; |
|
|
• |
unstable economic, political, and regulatory conditions; |
|
|
• |
supply chain complexities; |
|
|
• |
fluctuations in currency exchange rates; |
|
|
• |
potentially adverse tax consequences, tariffs, customs charges, bureaucratic requirements, and other trade barriers; and |
|
|
• |
difficulties protecting or procuring intellectual property rights. |
If one or more of these risks occurs, it could require us to dedicate significant resources to remedy, and if we are unsuccessful in finding a solution, our financial condition and results of operations will suffer.
In addition, on June 23, 2016, the United Kingdom (U.K.) held a referendum in which voters approved an exit from the European Union, commonly referred to as “Brexit.” In February 2017, the British Parliament voted in favor of allowing the British government to begin the formal process of Brexit and discussions with the European Union began in March 2017. Adverse consequences concerning Brexit or the future of the European Union could include deterioration in global economic conditions, instability in global financial markets, political uncertainty, volatility in currency exchange rates or adverse changes in the cross-border agreements currently in place, any of which could have an adverse impact on our financial results in the future.
A significant amount of our international product sales are currently denominated in U.S. dollars and fluctuations in the value of the U.S. dollar relative to foreign currencies could decrease demand for our products and adversely impact our financial performance. For example, if the value of the U.S. dollar increases relative to foreign currencies, our products could become more costly to the international consumer and therefore less competitive in international markets. Our results of operations and cash flows are, therefore, subject to fluctuations due to changes in foreign currency exchange rates. The volatility of exchange rates depends on many factors that we cannot forecast with reliable accuracy. We have experienced and will continue to experience fluctuations in our net income or loss as a result of transaction gains or losses related to revaluing certain current asset and current liability balances that are denominated in currencies other than the functional currency of the entities in which they are recorded. For example, for the year ended December 31, 2018, we experienced a net foreign currency loss of $0.7 million, and for the year ended December 31, 2017, we experienced a net foreign currency gain of $1.3 million, and for the year ended December 31, 2016, we experienced a net foreign currency loss of $0.3 million. Fluctuations in currency exchange rates could have an adverse impact on our financial results in the future. While we have a hedging program for Euros that attempts to manage currency exchange rate risks to an acceptable level based on management's judgment of the appropriate trade-off between risk, opportunity, and cost, this hedging program does not completely eliminate the effects of currency exchange rate fluctuations. In addition, currency hedging may result in a reduction or increase in revenue should the currency strengthen or decline during the contract period. A discussion of the hedging program is contained in Item 7A, Quantitative and Qualitative Disclosures about Market Risk in this Annual Report on Form 10-K for the year ended December 31, 2018. Additional information on our hedging arrangements is also contained in Note 8 to the consolidated financial statements in this Annual Report on Form 10-K.
33
We rely on shipping providers to deliver products to our customers globally. Labor, tariff, or World Trade Organization-related disputes, piracy, physical damage to shipping facilities or equipment caused by severe weather or terrorist incidents, congestion at shipping facilities, inadequate equipment to load, dock, and offload our products, energy-related tie-ups, or other factors could disrupt or delay shipping or offloading of our products domestically and internationally. Such disruptions or delays may have an adverse effect on our financial condition and results of operations.
Failure to comply with anti-bribery, anti-corruption, and anti-money laundering laws, including the U.S. Foreign Corrupt Practices Act of 1977, as amended, or the FCPA, and similar laws associated with our activities outside of the United States could subject us to penalties and other adverse consequences.
We are subject to the FCPA, the U.S. domestic bribery statute contained in 18 U.S.C. § 201, the U.S. Travel Act, the USA PATRIOT Act, the United Kingdom Bribery Act of 2010 and possibly other anti-corruption, anti-bribery and anti-money laundering laws in the more than forty countries around the world where we conduct activities and sell our products. We face significant risks and liability if we fail to comply with the FCPA and other anti-corruption and anti-bribery laws that prohibit companies and their employees and third-party business partners, such as distributors or resellers, from authorizing, offering or providing, directly or indirectly, improper payments or benefits to foreign government officials, political parties or candidates, employees of public international organizations including healthcare professionals, or private-sector recipients for the corrupt purpose of obtaining or retaining business, directing business to any person, or securing any advantage.
We leverage various third parties to sell our products and conduct our business abroad. We, our distributors and channel partners, and our other third-party intermediaries and manufacturer may have direct or indirect interactions with officials and employees of government agencies or state-owned or affiliated entities (such as in the context of obtaining government approvals, registrations, or licenses) and may be held liable for the corrupt or other illegal activities of these third-party business partners and intermediaries, our employees, representatives, contractors, partners, and agents, even if we do not explicitly authorize such activities. In many foreign countries, particularly in countries with developing economies, it may be a local custom that businesses engage in practices that are prohibited by the FCPA or other applicable laws and regulations. We provide training to all employees, including management, to ensure compliance with the FCPA. As such, we intend to continue to implement an FCPA/anti-corruption compliance program to ensure compliance with such laws but cannot assure you that all of our employees and agents, as well as those companies to which we outsource certain of our business operations, will not take actions in violation of our policies and applicable law, for which we have to defend ourselves and may be ultimately held responsible.
Any violation of the FCPA, other applicable anti-bribery, anti-corruption laws, and anti-money laundering laws could result in whistleblower complaints, adverse media coverage, investigations, loss of export privileges, severe criminal or civil sanctions and, in the case of the FCPA, suspension or debarment from U.S. government contracts, which could have a material and adverse effect on our reputation, business, operating results and prospects. In addition, responding to any enforcement action or related investigation may result in a materially significant diversion of management’s attention and resources and significant defense costs and other professional fees.
If we fail to comply with U.S. export control and economic sanctions or fail to expand and maintain an effective sales force or successfully develop our international distribution network, our business, financial condition and results of operations may be adversely affected.
We currently derive the majority of our revenue from rentals or sales generated from our own direct sales force. Failure to maintain or expand our direct sales force could adversely affect our financial condition and results of operations. Additionally, we use international distributors to augment our sales efforts, certain of which are exclusive distributors in certain foreign countries. We cannot assure you that we will be able to successfully retain or develop our relationships with third-party distributors internationally. In addition, we are subject to United States export control and economic sanctions laws relating to the sale of our products, the violation of which could result in substantial penalties being imposed against us. In particular, we have secured annual export licenses from the U.S. Treasury Department’s Office of Foreign Assets Control to sell our products to a distributor and hospital and clinic end-users in Iran. The use of this license requires us to observe strict conditions with respect to products sold, end-user limitations and payment requirements. Although we believe we have maintained compliance with license requirements, there can be no assurance that the license will not be revoked, be renewed in the future or that we will remain in compliance. More broadly, if we fail to comply with export control laws or successfully develop our relationship with international distributors, our sales could fail to grow or could decline, and our ability to grow our business could be adversely affected. Distributors that are in the business of selling other medical products may not devote a sufficient level of resources and support required to generate awareness of our products and grow or maintain product sales. If our distributors are unwilling or unable to market and sell our products, or if they do not perform to our expectations, we could experience delayed or reduced market acceptance and sales of our products resulting in adverse results of operations.
34
We may be subject to substantial warranty or product liability claims or other litigation in the ordinary course of business that may adversely affect our business, financial condition and results of operations.
As manufacturers of medical devices, we may be subject to substantial warranty or product liability claims or other litigation in the ordinary course of business that may require us to make significant expenditures to defend these claims or pay damage awards. For example, our Inogen One systems contain lithium ion batteries, which, under certain circumstances, can be a fire hazard. We, as well as our key suppliers, maintain product liability insurance, but this insurance is limited in amount and subject to significant deductibles. There is no guarantee that insurance will be available or adequate to protect against all claims. Our insurance policies are subject to annual renewal and we may not be able to obtain liability or product insurance in the future on acceptable terms or at all. In addition, our insurance premiums could be subject to increases in the future, which may be material. If the coverage limits are inadequate to cover our liabilities or our insurance costs continue to increase as a result of warranty or product liability claims or other litigation, then our business, financial condition and results of operations may be adversely affected.
We may also be subject to other types of claims arising from our normal business activities. These may include claims, suits, and proceedings involving labor and employment, wage and hour, commercial, alleged securities laws violations or other investor claims, patent defense and other matters. The outcome of any litigation, regardless of its merits, is inherently uncertain. Any claims and lawsuits, and the disposition of such claims and lawsuits, could be time-consuming and expensive to resolve, divert management attention and resources, and lead to attempts on the part of other parties to pursue similar claims. Any adverse determination related to litigation could require us to change our technology or our business practices, pay monetary damages or enter into royalty or licensing arrangements, which could adversely affect our business, financial condition and results of operations.
Increases in our operating costs could have a material adverse effect on our business, financial condition and results of operations.
Reimbursement rates are established by fee schedules mandated by Medicare, private payors and Medicaid, and are likely to remain constant or decrease due, in part, to federal and state government budgetary constraints. As a result, with respect to Medicare and Medicaid related revenue, we are not able to offset the effects of general inflation on our operating costs through increases in prices for our products. In particular, labor and related costs account for a significant portion of our operating costs and we compete with other healthcare providers to attract and retain qualified or skilled personnel and with various industries for administrative and service employees. This competitive environment could result in increased labor costs. As such, we must control our operating costs, particularly labor and related costs and failing to do so could adversely affect our financial condition and results of operations.
We depend on the services of our senior executives and other key technical personnel, the loss of whom could negatively affect our business.
Our success depends upon the skills, experience and efforts of our senior executives and other key technical personnel, including certain members of our engineering, accounting and compliance staff as well as our sales and marketing personnel. Much of our corporate expertise is concentrated in relatively few employees, the loss of which for any reason could negatively affect our business. Competition for our highly skilled employees is intense and we cannot prevent the resignation of any employee. We do not maintain “key man” life insurance on any of our senior executives. None of our senior executive team is bound by written employment contracts to remain with us for a specified period. In addition, we have not entered into non-compete agreements with members of our executive management team. The loss of any member of our executive management team could harm our ability to implement our business strategy and respond to the market conditions in which we operate.
We and our vendors and service providers rely on information technology networks and systems, and if we are unable to protect against service interruptions, data corruption, cybersecurity risks, data security incidents and/or network security breaches, our operations could be disrupted and our business could be negatively affected.
We rely on information technology networks and systems to process, transmit and store electronic, customer, operational, compliance, and financial information; to coordinate our business; and to communicate within our company and with customers, suppliers, partners and other third-parties. These information technology networks and systems may be susceptible to damage, disruptions or shutdowns, hardware or software failures, power outages, computer viruses, cybersecurity risks, data security incidents, telecommunication failures, user errors or catastrophic events. Like other companies, we have experienced data security incidents before. For example, on April 13, 2018, we announced that messages within an employee email account were accessed by unknown persons outside of our company without authorization. Some of the messages and attached files in that email account contained personal information belonging to our rental customers. We immediately took steps to secure customer information and hired a leading forensics firm to investigate the incident and to bolster our security. The unauthorized access of the potentially impacted email account appears to have occurred between January 2, 2018 and March 14, 2018. We notified approximately 30,000 current and former rental customers of this incident as well as the applicable regulatory authorities. We also provided resources, including credit monitoring and an insurance reimbursement policy, to assist all potentially affected individuals. We have incurred remedial, legal and
35
other costs in connection with this incident. We have insurance coverage in place for certain potential liabilities and costs relating to service interruptions, data corruption, cybersecurity risks, data security incidents and/or network security breaches, but this insurance is limited in amount, subject to a deductible, and may not be adequate to cover us for all costs arising from these incidents.
If our information technology networks and systems suffer unauthorized access, severe damage, disruption or shutdown, and our business does not effectively identify or resolve the issues in a timely manner, our operations could be disrupted, we could be subject to regulatory and consumer lawsuits and our business could be negatively affected. In addition, cybersecurity risks and data security incidents could lead to potential unauthorized access to or acquisition of confidential information (including protected health information), and data loss and corruption. There is no assurance that we will not experience service interruptions, security breaches, cyber security risks and data security incidents, or other information technology failures in the future.
The methods used to obtain unauthorized access, disable or degrade service or sabotage systems are constantly evolving and may be difficult to anticipate or to detect for long periods of time. As a result of these types of risks and attacks, we have implemented and periodically review and update systems, processes, and procedures to protect against unauthorized access to or use of data and to prevent data loss. For example, we have recently increased the security of our systems by requiring all email users to change their passwords following our recent data security incident and sooner than they would have otherwise been required to. We also implemented multi-factor authentication for remote email access and have taken additional steps to further limit access to our systems. However, the ever-evolving threats mean we and our third-party service providers and vendors must continually evaluate and adapt our respective systems and processes and overall security environment. There is no guarantee that these measures will be adequate to safeguard against all data security breaches, system compromises or misuses of data.
The compromise of our technology systems resulting in the loss, disclosure, misappropriation of, or access to, customers’, employees’ or business partners’ information or failure to comply with regulatory or contractual obligations with respect to such information could result in legal claims or proceedings, liability or regulatory penalties under laws protecting the privacy of personal information, disruption to our operations and damage to our reputation, any or all of which could adversely affect our business. The costs to remediate breaches and similar system compromises that do occur could adversely affect our results of operations.
In addition, we must comply with increasingly complex and rigorous regulatory standards enacted to protect business and personal data in the U.S., Europe and elsewhere. For example, the European Union adopted the GDPR, which became effective on May 25, 2018. The GDPR imposes additional obligations on companies regarding the processing of personal data and provides certain individual privacy rights to natural persons whose data is stored. Compliance with existing, proposed and recently enacted laws (including implementation of the privacy and process enhancements called for under GDPR) and regulations can be costly and any failure to comply with these regulatory standards could subject us to legal and reputational risks. Misuse of or failure to secure or properly process personal information could also result in violation of data privacy laws and regulations, proceedings against the Company by governmental entities or others, damage to our reputation and credibility and could have a negative impact on revenues and profits. As the regulatory environment related to information security, data collection and use, and privacy becomes increasingly rigorous, with new and constantly changing requirements applicable to our business, compliance with those requirements could continue to result in significant costs.
Our financial condition and results of operations may vary significantly from quarter-to-quarter due to a number of factors, which may lead to volatility in our stock price.
Our quarterly revenue and results of operations have varied in the past and may continue to vary significantly from quarter-to-quarter. This variability may lead to volatility in our stock price as research analysts and investors respond to these quarterly fluctuations. These fluctuations are due to numerous factors, including: fluctuations in consumer demand for our products; seasonal cycles in consumer spending; our ability to design, manufacture and deliver products to our consumers in a timely and cost-effective manner; quality control problems in our manufacturing operations; our ability to timely obtain adequate quantities of the components used in our products; new product introductions and enhancements by us and our competitors; unanticipated increases in costs or expenses; unanticipated regulatory reimbursement changes that could result in positive or negative impacts to our earnings; changes or updates to generally accepted accounting principles; and fluctuations in foreign currency exchange rates. As more HME providers adopt portable oxygen concentrators in their businesses, we expect that this could change our historical seasonality in the domestic business-to-business channel as well, which was previously influenced mainly by consumer buying patterns. The foregoing factors are difficult to forecast, and these, as well as other factors, could materially and adversely affect our quarterly and annual results of operations. We have experienced significant revenue growth in the past, but we may not achieve similar growth rates, profit margins and/or net income in future periods. You should not rely on our operating results for any prior quarterly or annual period as an indication of our future operating performance. If we are unable to maintain adequate revenue growth and cost control, our operating results could suffer, and our stock price could decline. In addition, a significant amount of our operating expenses are relatively fixed due to our manufacturing, research and development and sales and general administrative efforts. Any failure to adjust spending quickly enough to compensate for a revenue shortfall could magnify the adverse impact of such revenue shortfall on our results of operations. Our results of operations may not meet the expectations of research analysts or investors, in which case the price of our common stock could decrease significantly.
36
Given our levels of stock-based compensation, our tax rate may vary significantly depending on our stock price.
The tax effects of the accounting for share-based compensation may significantly impact our effective tax rate from period to period. In periods in which our stock price is higher than the grant price of the stock-based compensation vesting in that period, we will recognize excess tax benefits that will decrease our effective tax rate. For example, in 2018 excess tax benefits recognized from stock-based compensation decreased our provision for income taxes by $21.2 million and our effective tax rate by 52.5% as compared to the tax rate without such benefits. In future periods in which our stock price may be lower than the grant price of the stock-based compensation vesting in that period, our effective tax rate may increase. The amount and value of stock-based compensation issued relative to our earnings in a particular period will also affect the magnitude of the impact of stock-based compensation on our effective tax rate. These tax effects are dependent on our stock price and employee stock option exercises, which we do not control, and a decline in our stock price could significantly increase our effective tax rate and adversely affect our results of operations.
If the market opportunities for our products are smaller than we believe they are, our revenues may be adversely affected and our business may suffer.
Our projections regarding (i) the size of the oxygen therapy market, both in the United States and internationally, (ii) the size and percentage of the long-term oxygen therapy market that is subject to competitive bidding in the United States, (iii) the number of oxygen therapy patients, (iv) the number of patients requiring ambulatory and stationary oxygen, (v) the number of patients who rely on the delivery model, (vi) the percentage of the long-term oxygen therapy market serviced by Medicare, Medicare Advantage, and other third party-payors, (vii) the size of the retail long-term oxygen therapy market and how the opportunity may change as POC penetration increases, and (viii) the share of portable oxygen concentrators as a percentage of the total oxygen therapy spend are based on estimates that we believe are reliable. These estimates may prove to be incorrect, new data or studies may change the estimated incidence or prevalence of patients requiring long-term oxygen therapy, or the type of long-term oxygen therapy patients. The number of patients in the United States and internationally may turn out to be lower than expected, patients may not be otherwise amenable to treatment with our products, or new patients may become increasingly difficult to identify or gain access to, all of which would adversely affect our results of operations and our business.
An adverse outcome of a sales and use tax audit could have a material adverse effect on our results of operations and financial condition.
The California State Board of Equalization conducted a sales and use tax audit of our operations in California in 2008. As a result of the audit, the California State Board of Equalization confirmed that our sales are not subject to California sales and use tax. We believe that our sales in three states may be subject to sales and use tax, but in other states they should be exempt from sales and use tax. There can be no assurance, however, that other states may agree with our position and we may be subject to an audit that may not be resolved in our favor. Such an audit could be expensive and time-consuming and result in substantial management distraction. If the matter were to be resolved in a manner adverse to us, it could have a material adverse effect on our results of operations and financial condition.
Changes in accounting principles, or interpretations thereof, could have a significant effect on our financial condition and results of operations.
We prepare our consolidated financial statements in accordance with accounting principles generally accepted in the United States of America, referred to as U.S. GAAP. These principles are subject to interpretation by the Securities and Exchange Commission (SEC) and various bodies formed to interpret and create appropriate accounting principles. A change in these principles can have a significant effect on our reported results and may even retroactively affect previously reported transactions. Additionally, the adoption of new or revised accounting principles may require that we make significant changes to our systems, processes and controls.
For example, the U.S.-based Financial Accounting Standards Board, referred to as FASB, is currently working together with the International Accounting Standards Board, referred to as IASB, on several projects to further align accounting principles and facilitate more comparable financial reporting between companies who are required to follow U.S. GAAP under SEC regulations and those who are required to follow International Financial Reporting Standards outside of the United States. These efforts by the FASB and IASB may result in different accounting principles under U.S. GAAP that may result in materially different financial results for us in areas including, but not limited to, principles for recognizing revenue and lease accounting. Additionally, significant changes to U.S. GAAP resulting from the FASB’s and IASB’s efforts may require that we change how we process, analyze and report financial information and that we change financial reporting controls.
37
It is not clear if or when these potential changes in accounting principles may become effective, whether we have the proper systems and controls in place to accommodate such changes and the impact that any such changes may have on our financial condition and results of operations.
Our ability to use net operating losses to offset future taxable income may be subject to certain limitations.
Utilization of our net operating loss and tax credit carryforwards may be subject to annual limitations arising from ownership change limitations imposed by the Internal Revenue Code and similar state provisions. Such annual limitations could result in the expiration of the net operating loss and tax credit carryforwards before their utilization.
Uncertainties in the interpretation and application of the 2017 Tax Cuts and Jobs Act could materially affect our tax obligations and effective tax rate.
The 2017 Tax Cuts and Jobs Act (TCJA) was enacted on December 22, 2017, and significantly affected U.S. tax law by changing how the U.S. imposes income tax. The TCJA requires complex computations to be performed that were not previously required by U.S. tax law, significant judgments to be made in interpretation of the provisions of the TCJA, significant estimates in calculations, and the preparation and analysis of information not previously relevant or regularly produced. The U.S. Treasury Department, the IRS, and other standard-setting bodies will continue to interpret or issue guidance on how provisions of the TCJA will be applied or otherwise administered. As future guidance is issued, we may make adjustments to amounts that we have previously recorded that may materially affect our financial statements in the period in which the adjustments are made.
Changes in tax laws or tax rulings could materially affect our financial condition, results of operations, and cash flows.
The income and non-income tax regimes we are subject to or operate under are unsettled and may be subject to significant change. Changes in tax law or tax rulings, or changes in interpretations of existing law, could adversely affect our financial condition and results of operations. For example, changes to the U.S. tax laws enacted in December 2017 had a significant impact on our deferred tax assets, income tax provision and effective tax rate for the year ended December 31, 2017. In addition, many countries in Europe, as well as a number of other countries and organizations, have recently proposed or recommended changes to existing tax laws or have enacted new laws that could significantly increase our tax obligations in many countries where we do business or require us to change the manner in which we operate our business.
Risks related to the regulatory environment
We are subject to extensive federal and state regulation, and if we fail to comply with applicable regulations, we could suffer severe criminal or civil sanctions and be required to make significant changes to our operations that could adversely affect our business, financial condition and results of operations.
The federal government and all states in which we currently operate regulate various aspects of our business. In particular, our operations are subject to state laws governing, among other things, distribution of medical equipment and certain types of home health activities, and we are required to obtain and maintain licenses in many states to act as a durable medical equipment supplier. Certain of our employees are subject to state laws and regulations governing the professional practices of respiratory therapy.
As a healthcare provider participating in governmental healthcare programs, we are subject to laws directed at preventing fraud and abuse, which subject our marketing, billing, documentation and other practices to strict government scrutiny. To ensure compliance with Medicare, Medicaid and other regulations, government agencies or their contractors often conduct routine audits and request customer records and other documents to support our claims submitted for payment of services rendered. Government agencies or their contractors also periodically open investigations and obtain information from healthcare providers. Violations of federal and state regulations can result in severe criminal, civil and administrative fines, penalties and sanctions, including debarment, suspension or exclusion from Medicare, Medicaid and other government reimbursement programs, any of which would have a material adverse effect on our business.
Changes in healthcare laws and regulations and new interpretations of existing laws and regulations may affect permissible activities, the relative costs associated with doing business, and reimbursement amounts paid by federal, state and other third-party payors. There have been and will continue to be regulatory initiatives affecting our business and we cannot predict the extent to which future legislation and regulatory changes could have a material adverse effect on our business.
38
We are subject to significant regulation by numerous government agencies, including the U.S. Food and Drug Administration, or FDA. We cannot market or commercially distribute our products without obtaining and maintaining necessary regulatory clearances or approvals.
Our Inogen concentrators are medical devices subject to extensive regulation in the United States and in the foreign markets where we distribute our products. The FDA and other U.S. and foreign governmental agencies regulate, among other things, with respect to medical devices:
|
|
• |
design, development and manufacturing; |
|
|
• |
testing, labeling, content and language of instructions for use and storage; |
|
|
• |
clinical trials; |
|
|
• |
product safety; |
|
|
• |
marketing, sales and distribution; |
|
|
• |
pre-market clearance and approval; |
|
|
• |
record keeping; |
|
|
• |
advertising and promotion; |
|
|
• |
recalls and field safety corrective actions; |
|
|
• |
post-market surveillance, including reporting of deaths or serious injuries and malfunctions that, if they were to recur, could lead to death or serious injury; |
|
|
• |
post-market approval studies; and |
|
|
• |
product import and export. |
Before we can market or sell a medical device in the United States, we must obtain either clearance from the FDA under Section 510(k) of the Federal Food, Drug, and Cosmetic Act, or the FDCA, or approval of a pre-market approval application from the FDA, unless an exemption applies. In the 510(k) clearance process, the FDA must determine that a proposed device is “substantially equivalent” to a device legally on the market, known as a “predicate” device, with respect to intended use, technology and safety and effectiveness, in order to clear the proposed device for marketing.
Our commercial products have received 510(k) clearance by the FDA. If the FDA requires us to go through a lengthier, more rigorous examination for future products or modifications to existing products than we had expected, our product introductions or modifications could be delayed or canceled, which could cause our sales to decline. In addition, the FDA may determine that future products will require the more costly, lengthy and uncertain pre-market approval process. Although we do not currently market any devices under a pre-market approval, the FDA may demand that we obtain a pre-market approval prior to marketing certain future products. In addition, if the FDA disagrees with our determination that a product we currently market is subject to an exemption from pre-market review, the FDA may require us to submit a 510(k) or pre-market approval application in order to continue marketing the product. Further, even with respect to those future products where a pre-market approval is not required, we cannot assure you that we will be able to obtain the 510(k) clearances with respect to those products or do so in a timely fashion.
The FDA can delay, limit or deny clearance or approval of a device for many reasons, including:
|
|
• |
we may not be able to demonstrate to the FDA’s satisfaction that our products are safe and effective for their intended uses; |
|
|
• |
the data from our pre-clinical studies and clinical trials may be insufficient to support clearance or approval, where required; and |
|
|
• |
the manufacturing process or facilities we use may not meet applicable Quality System Regulations. |
39
Medical devices may only be promoted and sold for the indications for which they are approved or cleared. In addition, even if the FDA has approved or cleared a product, it can take action affecting such product approvals or clearances if serious safety or other problems develop in the marketplace. Delays in obtaining clearances or approvals could adversely affect our ability to introduce new products or modifications to our existing products in a timely manner, which would delay or prevent commercial sales of our products. Additionally, the FDA and other regulatory authorities have broad enforcement powers. Regulatory enforcement or inquiries, or other increased scrutiny on us, could affect the perceived safety and performance of our products and dissuade our customers from using our products.
If we modify our FDA cleared devices, we may need to seek additional clearances or approvals, which, if not granted, would prevent us from selling our modified products.
Any modification we make to our Inogen One systems and Inogen At Home system that could significantly affect their safety or effectiveness, or would constitute a major change in intended use, manufacture, design, materials, labeling, or technology requires the submission and clearance of a new 510(k) pre-market notification or, possibly, pre-market approval. The FDA requires every manufacturer to make this determination in the first instance, but the FDA may review and disagree with any manufacturer’s decision. The FDA may not agree with our decisions regarding whether new clearances or approvals are necessary. We have modified some of our 510(k) cleared products and have determined that in certain instances new 510(k) clearances or pre-market approval are not required. If the FDA disagrees with our determination and requires us to submit new 510(k) notifications or pre-market approval for modifications to our previously cleared products for which we have concluded that new clearances or approvals are unnecessary, we may be required to cease marketing or to recall the modified product until we obtain clearance or approval, and we may be subject to significant regulatory fines or penalties.
If we fail to comply with FDA or state regulatory requirements, we can be subject to enforcement action.
Even after we have obtained regulatory clearance or approval to market a product, we have ongoing responsibilities under FDA regulations. The FDA and state authorities have broad enforcement powers. Our failure to comply with applicable regulatory requirements could result in enforcement action by the FDA or state agencies, which may include any of the following sanctions:
|
|
• |
adverse publicity, warning letters, fines, injunctions, consent decrees and civil penalties; |
|
|
• |
recalls, termination of distribution, or seizure of our products; |
|
|
• |
operating restrictions or partial suspension or total shutdown of production; |
|
|
• |
delays in the introduction of products into the market; |
|
|
• |
refusal to grant our requests for future 510(k) clearances or approvals of new products, new intended uses, or modifications to exiting products; |
|
|
• |
withdrawals or suspensions of current 510(k) clearances or approvals, resulting in prohibitions on sales of our products; and |
|
|
• |
criminal prosecution. |
Any of these sanctions could result in higher than anticipated costs or lower than anticipated sales and have a material adverse effect on our reputation, business, results of operations and financial condition.
A recall of our products, either voluntarily or at the direction of the FDA or another governmental authority, or the discovery of serious safety issues with our products that leads to corrective actions, could have a significant adverse effect on us.
The FDA and similar foreign governmental authorities have the authority to require the recall of commercialized products in the event of material deficiencies or defects in design, labeling or manufacture of a product or in the event that a product poses an unacceptable risk to health. Manufacturers may also, under their own initiative, recall a product if any material deficiency in a device is found or withdraw a product to improve device performance or for other reasons. A government-mandated or voluntary recall by us or one of our distributors could occur as a result of an unacceptable risk to health, component failures, manufacturing errors, design or labeling defects or other deficiencies and issues. Similar regulatory agencies in other countries have similar authority to recall devices because of material deficiencies or defects in design or manufacture that could endanger health. Any recall would divert management attention and financial resources, could cause the price of our stock to decline and expose us to product liability or other claims and harm our reputation with customers. A recall involving our Inogen concentrators could be particularly harmful to our business, financial condition and results of operations.
40
We are required to timely report to the FDA any incident in which our product may have caused or contributed to a death or serious injury or in which our product malfunctioned and, if the malfunction were to recur, would likely cause or contribute to death or serious injury. Repeated product malfunctions may result in a voluntary or involuntary product recall. Depending on the corrective action we take to redress a product’s deficiencies or defects, the FDA may require, or we may decide, that we will need to obtain new approvals or clearances for the device before we may market or distribute the corrected device. Seeking such approvals or clearances may delay our ability to replace the recalled devices in a timely manner. Moreover, if we do not adequately address problems associated with our devices, we may face additional regulatory enforcement action, including adverse publicity, FDA warning letters, product seizure, injunctions, administrative penalties, or civil or criminal fines. We may also be required to bear other costs or take other actions that may have a negative impact on our sales as well as face significant adverse publicity or regulatory consequences, which could harm our business, including our ability to market our products in the future.
Any adverse event involving our products, whether in the United States or abroad, could result in future voluntary corrective actions, such as recalls or customer notifications, or agency action, such as inspection, mandatory recall or other enforcement action. Any corrective action, whether voluntary or involuntary, as well as defending ourselves in a lawsuit, will require the dedication of our time and capital, distract management from operating our business and may harm our reputation and results of operations.
If we, our contract manufacturer, or our component manufacturers fail to comply with the FDA’s Quality System Regulation, our manufacturing operations could be interrupted, and our product sales and operating results could suffer.
We, our contract manufacturer, and our component manufacturers are required to comply with the FDA’s Quality System Regulation, or QSR, which covers the procedures and documentation of the design, calibration, testing, production, control, quality assurance, labeling, packaging, storage and shipping of our devices. The FDA audits compliance with the QSR through periodic announced and unannounced inspections of manufacturing and other facilities. We and our component manufacturers have been, and anticipate in the future being, subject to such inspections. Although we believe our manufacturing facilities and those of our component manufacturers are in compliance with the QSR, we cannot provide assurance that any future inspection will not result in adverse findings. If we fail to implement timely and appropriate corrective actions that are acceptable to the FDA or if our other manufacturing facilities or those of any of our component manufacturers, contract manufacturers, or suppliers are found to be in violation of applicable laws and regulations, or we or our manufacturers or suppliers fail to take prompt and satisfactory corrective action in response to an adverse inspection, the FDA could take enforcement action, including any of the following sanctions:
|
|
• |
adverse publicity, untitled letters, warning letters, fines, injunctions, consent decrees and civil penalties; |
|
|
• |
customer notifications or repair, replacement, refunds, recall, detention or seizure of our products; |
|
|
• |
operating restrictions or partial suspension or total shutdown of production; |
|
|
• |
refusing or delaying our requests for 510(k) clearance or pre-market approval of new products or modified products; |
|
|
• |
withdrawing 510(k) clearances or pre-market approvals that have already been granted; |
|
|
• |
refusal to grant export approval for our products; or |
|
|
• |
criminal prosecution. |
Any of these sanctions could adversely affect our business, financial condition and results of operations.
Outside the United States, our products and operations are also often required to comply with standards set by industrial standards bodies, such as the International Organization for Standardization, or ISO. Foreign regulatory bodies may evaluate our products or the testing that our products undergo against these standards. The specific standards, types of evaluation and scope of review differ among foreign regulatory bodies. If we fail to adequately comply with any of these standards, a foreign regulatory body may take adverse actions similar to those within the power of the FDA. Any such action may harm our reputation and could have an adverse effect on our business, results of operations and financial condition.
The primary regulatory body in Europe is the European Commission, which includes most of the major countries in Europe. The European Commission has adopted numerous directives and standards regulating the design, manufacture, clinical trial, labeling and adverse event reporting for medical devices. Devices that comply with the requirements of a relevant directive will be entitled to bear the CE conformity marking, indicating that the device conforms to the essential requirements of the applicable directives and, accordingly, can be commercially distributed throughout Europe. The method of assessing conformity varies depending on the class of the product, but normally involves a combination of self-assessment by the manufacturer and a third-party assessment by a “Notified Body.” An assessment by a Notified Body of one country within the European Union is required in order for a manufacturer to commercially distribute the product throughout the European Union.
41
If we fail to obtain and maintain regulatory approval in foreign jurisdictions, our market opportunities will be limited.
Approximately 21.6%, 22.3%, and 24.7% of our revenue was from sales outside of the United States for the years ended December 31, 2018, 2017, and 2016, respectively. We sell our products in 46 countries outside of the United States through our wholly owned subsidiary, distributors or directly to large “house” accounts. In order to market our products in the European Union or other foreign jurisdictions, we must obtain and maintain separate regulatory approvals and comply with numerous and varying regulatory requirements. The approval procedure varies from country to country and can involve additional product testing. The time required to obtain approval abroad may be longer than the time required to obtain FDA clearance. The foreign regulatory approval process includes many of the risks associated with obtaining FDA clearance and we may not obtain foreign regulatory approvals on a timely basis, if at all. FDA clearance does not ensure approval by regulatory authorities in other countries, and approval by one foreign regulatory authority does not ensure approval by regulatory authorities in other foreign countries. However, the failure to obtain clearance or approval in one jurisdiction may have a negative impact on our ability to obtain clearance or approval elsewhere. If we do not obtain or maintain necessary approvals to commercialize our products in markets outside the United States, we may be required to discontinue sales in those countries which would negatively affect our overall market penetration, revenues, results of operations and financial condition.
We are subject to burdensome and complex billing and record-keeping requirements in order to substantiate our claims for payment under federal, state and commercial healthcare reimbursement programs, and our failure to comply with existing requirements, or changes in those requirements or interpretations thereof, could adversely affect our business, financial condition and results of operations.
We are subject to burdensome and complex billing and record-keeping requirements in order to substantiate our claims for payment under federal, state and commercial healthcare reimbursement programs. Our records also are subject to routine and other reviews by third-party payors, which can result in delays in payments or refunds of paid claims. We could experience a significant increase in pre-payment reviews of our claims by the Durable Medical Equipment Medicare Administrative Contractors, which could cause substantial delays in the collection of our Medicare accounts receivable as well as related amounts due under supplemental insurance plans.
Current law provides for a significant expansion of the government’s auditing and oversight of suppliers who care for patients covered by various government healthcare programs. Examples of this expansion include audit programs being implemented by the Durable Medical Equipment Medicare Administrative Contractors, the Zone Program Integrity Contractors, the Recovery Audit Contractors, and the Comprehensive Error Rate Testing contractors, operating under the direction of CMS, and the various state Medicaid Fraud Control Units.
We have been informed by these auditors that healthcare providers and suppliers of certain durable medical equipment product categories are expected to experience further increased scrutiny from these audit programs. When a government auditor ascribes a high billing error rate to one or more of our locations, it generally results in protracted pre-payment claims review, payment delays, refunds and other payments to the government and/or our need to request more documentation from providers than has historically been required. It may also result in additional audit activity in other company locations in that state or Durable Medical Equipment Medicare Administrative Contractors jurisdiction. We cannot currently predict the adverse impact that these audits, methodologies and interpretations might have on our business, financial condition or results of operations, but such impact could be material.
We may be subject to fines, penalties or injunctions if we are determined to be promoting the use of our products for unapproved or “off-label” uses, resulting in damage to our reputation and business.
Our promotional materials and training methods must comply with the FDA and other applicable laws and regulations, including the prohibition of the promotion of a medical device for a use that has not been cleared or approved by the FDA. Physicians may use our products off-label, as the FDA does not restrict or regulate a physician’s choice of treatment within the practice of medicine. If the FDA determines that our promotional materials or training constitutes promotion of an off-label use that is either false or misleading, it could request that we modify our training or promotional materials or subject us to regulatory or enforcement actions, which could have an adverse effect on our reputation and results of operations.
42
Failure to comply with the Federal Health Insurance Portability and Accountability Act of 1996, or HIPAA, the Health Information Technology for Economic and Clinical Health Act, or HITECH Act, and implementing regulations could result in significant penalties.
Numerous federal and state laws and regulations, including HIPAA and the HITECH Act, govern the collection, dissemination, security, use and confidentiality of patient-identifiable health information. HIPAA and the HITECH Act require us to comply with standards for the use and disclosure of protected health information within our company and with third parties. The Privacy Standards and Security Standards under HIPAA establish a set of basic national privacy and security standards for the protection of individually identifiable health information by health plans, healthcare clearinghouses and certain healthcare providers, referred to as covered entities, and the business associates with whom such covered entities contract for services. Notably, whereas HIPAA previously directly regulated only these covered entities, the HITECH Act, which was signed into law as part of the stimulus package in February 2009, makes certain of HIPAA’s privacy and security standards also directly applicable to covered entities’ business associates. As a result, both covered entities and business associates are now subject to significant civil and criminal penalties for failure to comply with Privacy Standards and Security Standards.
HIPAA requires healthcare providers like us to develop and maintain policies and procedures with respect to protected health information that is used or disclosed, including the adoption of administrative, physical and technical safeguards to protect such information from unauthorized disclosure. The HITECH Act expands the notification requirement for breaches of patient-identifiable health information, restricts certain disclosures and sales of patient-identifiable health information and provides a tiered system for civil monetary penalties for HIPAA violations. The HITECH Act also increased the civil and criminal penalties that may be imposed against covered entities, business associates and possibly other persons and gave state attorneys general new authority to file civil actions for damages or injunctions in federal courts to enforce the federal HIPAA laws and seek attorney fees and costs associated with pursuing federal civil actions. Additionally, certain states have adopted comparable privacy and security laws and regulations, some of which may be more stringent than HIPAA.
If we are determined to be out of compliance with existing or new laws and regulations related to patient health information, we could be subject to criminal or civil sanctions. New health information standards, whether implemented pursuant to HIPAA, the HITECH Act, congressional action or otherwise, could have a significant effect on the manner in which we handle healthcare related data and communicate with payors, and the cost of complying with these standards could be significant.
The 2013 final HITECH omnibus rule modifies the breach reporting standard in a manner that will likely make more data security incidents qualify as reportable breaches. Any liability from a failure to comply with the requirements of HIPAA or the HITECH Act could adversely affect our results of operations and financial condition. The costs of complying with privacy and security related legal and regulatory requirements are burdensome and could have a material adverse effect on our results of operations.
Regulations requiring the use of “standard transactions” for healthcare services issued under HIPAA may negatively affect our profitability and cash flows.
Pursuant to HIPAA, final regulations have been implemented to improve the efficiency and effectiveness of the healthcare system by facilitating the electronic exchange of information in certain financial and administrative transactions while protecting the privacy and security of the information exchanged.
The HIPAA transaction standards are complex, and subject to differences in interpretation by third-party payors. For instance, some third-party payors may interpret the standards to require us to provide certain types of information, including demographic information not usually provided to us by physicians. As a result of inconsistent application of transaction standards by third-party payors or our inability to obtain certain billing information not usually provided to us by physicians, we could face increased costs and complexity, a temporary disruption in accounts receivable and ongoing reductions in reimbursements and net revenue. In addition, requirements for additional standard transactions, such as claims attachments or use of a national provider identifier, could prove technically difficult, time-consuming or expensive to implement, all of which could harm our business.
43
If we fail to comply with state and federal fraud and abuse laws, including anti-kickback, Stark, false claims and anti-inducement laws, we could face substantial penalties and our business, results of operations and financial condition could be adversely affected.
The Federal Anti-Kickback Statute prohibits, among other things, knowingly and willfully offering, paying, soliciting or receiving remuneration to induce or in return for purchasing, leasing, ordering, or arranging for the purchase, lease or order of any healthcare item or service reimbursable under Medicare, Medicaid, or other federal healthcare programs. Although there are a number of statutory exceptions and regulatory safe harbors protecting certain common activities from prosecution, the exceptions and safe harbors are drawn narrowly, and any remuneration to or from a prescriber or purchaser of healthcare products or services may be subject to scrutiny if it does not qualify for an exception or safe harbor. Our practices may not in all cases meet all of the criteria for safe harbor protection from anti-kickback liability. Failure to meet all requirements of a safe harbor is not determinative of a kickback issue but could subject the practice to increased scrutiny by the government.
The “Stark Law” prohibits a physician from referring Medicare or Medicaid patients to an entity providing “designated health services,” which includes durable medical equipment, if the physician or immediate family member of the physician, has an ownership or investment interest in or compensation arrangement with such entity that does not comply with the requirements of a Stark exception. Violation of the Stark Law could result in denial of payment, disgorgement of reimbursements received under a non-compliant arrangement, civil penalties, and exclusion from Medicare, Medicaid or other governmental programs. Although we believe that we have structured our provider arrangements to comply with current Stark Law requirements, these arrangements may not expressly meet the requirements for applicable exceptions from the law.
Federal false claims laws prohibit any person from knowingly presenting or causing to be presented a false claim for payment to the federal government, or knowingly making or causing to be made a false statement to get a false claim paid. The majority of states also have statutes or regulations similar to the federal anti-kickback and self-referral laws and false claims laws, which apply to items or services, reimbursed under Medicaid and other state programs, or, in several states, apply regardless of payor. These false claims statutes allow any person to bring suit in the name of the government alleging false and fraudulent claims presented to or paid by the government (or other violations of the statutes) and to share in any amounts paid by the entity to the government in fines or settlement. Such suits, known as qui tam actions, have increased significantly in the healthcare industry in recent years. Sanctions under these federal and state laws may include civil monetary penalties, exclusion of a manufacturer’s products from reimbursement under government programs, criminal fines and imprisonment. In addition, the recently enacted Patient Protection and Affordable Care Act, among other things, amends the intent requirement of the federal anti-kickback and criminal healthcare fraud statutes. A person or entity no longer needs to have actual knowledge of this statute or specific intent to violate it. In addition, the Patient Protection and Affordable Care Act provides that the government may assert that a claim including items or services resulting from a violation of the federal anti-kickback statute constitutes a false or fraudulent claim for purposes of the false claims statutes. Because of the breadth of these laws and the narrowness of the safe harbors and exceptions, it is possible that some of our business activities could be subject to challenge under one or more of such laws. Such a challenge, regardless of the outcome, could have a material adverse effect on our business, business relationships, reputation, financial condition and results of operations.
The Patient Protection and Affordable Care Act also imposes annual reporting and disclosure requirements on device and drug manufacturers for “transfers of value” made or distributed to licensed physicians and teaching hospitals. Device and drug manufacturers are also required to report and disclose annually any investment interests held by physicians and their immediate family members during the preceding calendar year. Failure to submit required information may result in civil monetary penalties of up to an aggregate of $0.17 million per year (and up to an aggregate of $1.128 million per year for “knowing failures”), for all payments, transfers of value or ownership or investment interests not reported in an annual submission.
In addition, there has been a recent trend of increased federal and state regulation of payments made to physicians. Certain states, mandate implementation of compliance programs and/or the tracking and reporting of gifts, compensation and other remuneration to physicians. The shifting compliance environment and the need to build and maintain robust and expandable systems to comply with different compliance and/or reporting requirements in multiple jurisdictions increase the possibility that a healthcare company many violate one or more of the requirements.
The Federal Civil Monetary Penalties Law prohibits the offering or giving of remuneration to a Medicare or Medicaid beneficiary that the person knows or should know is likely to influence the beneficiary’s selection of a particular supplier of items or services reimbursable by a Federal or state governmental healthcare program. We sometimes offer customers various discounts and other financial incentives in connection with the sales of our products. While it is our intent to comply with all applicable laws, the government may find that our marketing activities violate the Civil Monetary Penalties Law. If we are found to be in non-compliance, we could be subject to civil money penalties of up to $0.02 million for each wrongful act, assessment of three times the amount claimed for each item or service and exclusion from the federal or state healthcare programs.
44
On February 3, 2017, the Department of Justice (DOJ) published a final rule that applies an inflation adjustment to civil monetary penalty (CMP) amounts, as mandated by the Bipartisan Budget Act of 2015. The maximum CMP for False Claims Act violations is $0.02 million for civil penalties assessed after August 1, 2016 and whose violations occurred after November 2, 2015.
The Bipartisan Budget Act of 2018 increases the CMP and criminal fines and sentences for various fraud and abuse violations under the Medicare and Medicaid programs for violations committed after February 9, 2018. The new maximum CMP for a False Claims Act violation is $0.02 million.
The scope and enforcement of each of these laws is uncertain and subject to rapid change in the current environment of healthcare reform, especially in light of the lack of applicable precedent and regulations. If our operations are found to be in violation of any of the laws described above or any other government regulations that apply to us, we may be subject to penalties, including civil and criminal penalties, damages, fines and the curtailment or restricting of our operations. Any penalties, damages, fines, curtailment or restructuring or our operations could harm our ability to operate our business and our results of operations. Any action against us for violation of these laws, even if we successfully defend against it, could cause us to incur significant legal expenses and divert our management’s attention from operation of our business. Moreover, achieving and sustaining compliance with applicable federal and state fraud laws may prove costly.
Foreign governments tend to impose strict price controls, which may adversely affect our future profitability.
We sell our products in 46 countries outside the United States through our wholly owned subsidiary, distributors or directly to large “house” accounts. In some foreign countries, particularly in the European Union, the pricing of medical devices is subject to governmental control. In these countries, pricing negotiations with governmental authorities can take considerable time after the receipt of marketing approval for a product. To obtain reimbursement or pricing approval in some countries, we may be required to supply data that compares the cost-effectiveness of our Inogen One and Inogen At Home systems to other available oxygen therapies. If reimbursement of our products is unavailable or limited in scope or amount, or if pricing is set at unsatisfactory levels, it may not be profitable to sell our products in certain foreign countries, which would negatively affect the long-term growth of our business.
Our business activities involve the use of hazardous materials, which require compliance with environmental and occupational safety laws regulating the use of such materials. If we violate these laws, we could be subject to significant fines, liabilities or other adverse consequences.
Our research and development programs as well as our manufacturing operations involve the controlled use of hazardous materials. Accordingly, we are subject to international, federal, state and local laws governing the use, handling and disposal of these materials. Although we believe that our safety procedures for handling and disposing of these materials comply in all material respects with the standards prescribed by state and federal regulations of each country in which we conduct business, we cannot completely eliminate the risk of accidental contamination or injury from these materials. In the event of an accident or failure to comply with environmental laws, we could be held liable for resulting damages, and any such liability could exceed our insurance coverage and adversely affect our financial condition and results of operations.
New regulatory requirements under Proposition 65 could adversely affect our business.
We are subject to California’s Proposition 65, or Prop 65, which requires a specific warning on any product that contains a substance listed by the State of California as having been found to cause cancer or birth defects, unless the level of such substance in the product is below a safe harbor level. Prop 65 required that all businesses must be in compliance by August 30, 2018 with new regulations that require modifications to product warnings and for businesses to coordinate with upstream vendors or downstream customers for the 800+ regulated chemicals in consumer products and assess whether new occupational exposure warnings need to be posited in California facilities. We have taken steps to add warning labels to our products packaged in California and manufactured after August 30, 2018. Although we cannot predict the ultimate impact of these new requirements, they could reduce overall consumption of our products or leave consumers with the perception (whether or not valid) that our products do not meet their health and wellness needs, all of which could adversely affect our business, financial condition and results of operations.
45
Risks related to our intellectual property
If we are unable to secure and maintain patent or other intellectual property protection for the intellectual property used in our products, we will lose a significant competitive advantage, which may adversely affect our future profitability.
Our commercial success depends, in part, on obtaining, defending, and maintaining patent and other intellectual property protection for the technologies used in our products. The patent positions of medical device companies, including ours, can be highly uncertain and involve complex and evolving legal and factual questions. Furthermore, we might in the future opt to license intellectual property from other parties. If we, or the other parties from whom we would license intellectual property, fail to obtain, defend, and maintain adequate patent or other intellectual property protection for intellectual property used in our products, or if any protection is reduced or eliminated, others could use the intellectual property used in our products, resulting in harm to our competitive business position. In addition, patent and other intellectual property protection may not:
|
|
• |
prevent our competitors from duplicating our products; |
|
|
• |
prevent our competitors from gaining access to our proprietary information and technology |
|
|
• |
prevent our competitors or other parties from suing us for alleged infringement; or |
|
|
• |
permit us to gain or maintain a competitive advantage. |
Any of our patents may be challenged, invalidated, circumvented or rendered unenforceable. We cannot provide assurance that we will be successful should one or more of our patents be challenged for any reason. If our patent claims are rendered invalid or unenforceable, or narrowed in scope, the patent coverage afforded our products could be impaired, which could make our products less competitive.
As of December 31, 2018, we have seven pending patent applications and one pending international patent application, thirty-three issued patents relating to the design and construction of our oxygen concentrators and our intelligent delivery technology. We cannot specify which of these patents individually or as a group will permit us to gain or maintain a competitive advantage. Patents may be subject to reexamination, inter partes review, post-grant review, and derivation proceedings in the U.S. Patent and Trademark Office or comparable proceedings in other patent offices worldwide. Foreign patents may be subject to opposition or comparable proceedings in the corresponding foreign patent offices. Any of these proceedings could result in loss of the patent or denial of the patent application, or loss or reduction in the scope of one or more of the claims of the patent or patent application. Changes in either patent laws or in interpretations of patent laws may also diminish the value of our intellectual property or narrow the scope of our protection. Interference, reexamination, inter partes review, defense, and opposition proceedings may be costly and time consuming, and we, or the other parties from whom we might potentially license intellectual property, may be unsuccessful in defending against such proceedings. Thus, any patents that we own or might license may provide limited or no protection against competitors. In addition, our pending patent applications and those we may file in the future may have claims narrowed during prosecution or may not result in patents being issued. Even if any of our pending or future applications are issued, they may not provide us with any competitive advantage or adequate protection from allegations of infringement, whether valid or frivolous, which may result in the incurrence of material defense costs. Our patents and patent applications are directed to particular aspects of our products. Other parties may develop and obtain patent protection for more effective technologies, designs or methods for oxygen therapy. If these developments were to occur, it would likely have an adverse effect on our sales. Our ability to develop additional patentable technology is also uncertain.
Non-payment or delay in payment of patent fees or annuities, whether intentional or unintentional, may also result in the loss of patents or patent rights important to our business. Many countries, including certain countries in Europe, have compulsory licensing laws under which a patent owner may be compelled to grant licenses to other parties. In addition, many countries limit the enforceability of patents against other parties, including government agencies or government contractors. In these countries, the patent owner may have limited remedies, which could materially diminish the value of the patent. In addition, the laws of some foreign countries do not protect intellectual property rights to the same extent as do the laws of the United States, particularly in the field of medical products and procedures.
46
Our products could infringe or appear to infringe the intellectual property rights of others, which may lead to patent and other intellectual property litigation that could itself be costly, could result in the payment of substantial damages or royalties, prevent us from using technology that is essential to our products, and/or force us to discontinue selling our products.
The medical device industry in general has been characterized by extensive litigation and administrative proceedings regarding patent infringement and intellectual property rights. Our competitors hold a significant number of patents relating to oxygen therapy devices and products. Third parties have in the past asserted and may in the future assert that we are employing their proprietary technology without authorization. For example, Separation Design Group IP Holdings, LLC (SDGIP) filed a lawsuit against us on October 23, 2015 in the United States District Court for the Central District of California. SDGIP alleged that we willfully infringed U.S. Patent Nos. 8,894,751 and 9,199,055, both of which are titled “Ultra Rapid Cycle Portable Oxygen Concentrator.” SDGIP also alleged misappropriation of trade secrets and breach of contract stemming from a meeting in September 2010. SDGIP sought to recover damages (including compensatory and treble damages), costs and expenses (including attorneys’ fees), pre-judgment and post-judgment interest, and other relief that the Court deem proper. SDGIP also sought a permanent injunction against us. Additionally, CAIRE, Inc. (CAIRE) filed a lawsuit in the United States District Court for the Northern District of Georgia against us on September 12, 2016. CAIRE alleged that we infringed U.S. Patent No. 6,949,133, entitled “Portable Oxygen Concentrator.” While we settled our lawsuit with SDGIP in October 2017 and with CAIRE in December 2017, if we fail in defending against similar lawsuits or claims brought against us in the future, we could be subject to substantial monetary damages and injunctive relief, and we cannot predict the outcome of any lawsuit. An adverse determination or protracted defense costs of pending lawsuits could have a material effect on our business and operating results.
From time to time, we have also commenced litigation to enforce our intellectual property rights. For example, we previously pursued litigation against Inova Labs, Inc. (a subsidiary of ResMed Corp.) for infringement of two of our patents seeking damages, injunctive relief, costs, and attorneys’ fees. While we settled our lawsuit with Inova Labs in June 2016, an adverse decision in any other legal action could limit our ability to assert our intellectual property rights, limit the value of our technology or otherwise negatively affect our business, financial condition and results of operations.
Monitoring unauthorized use of our intellectual property is difficult and costly. Unauthorized use of our intellectual property may have occurred or may occur in the future. Although we have taken steps to minimize the risk of this occurring, any such failure to identify unauthorized use and otherwise adequately protect our intellectual property would adversely affect our business. Moreover, if we are required to commence litigation, whether as a plaintiff or defendant as has occurred with Inova Labs, SDGIP, and CAIRE, not only will this be time-consuming, but we will also be forced to incur significant costs and divert our attention and efforts of our employees, which could, in turn, result in lower revenue and higher expenses.
We cannot provide assurance that our products or methods do not infringe or appear to not infringe the patents or other intellectual property rights of third parties and if our business is successful, the possibility may increase that others will assert infringement claims against us whether valid or frivolous.
Determining whether a product infringes a patent involves complex legal and factual issues, defense costs and the outcome of a patent litigation action are often uncertain. We have not conducted an extensive search of patents issued or assigned to other parties, including our competitors, and no assurance can be given that patents containing claims covering or appearing to cover our products, parts of our products, technology or methods do not exist, have not been filed or could not be filed or issued. Because of the number of patents issued and patent applications filed in our technical areas, our competitors or other parties may assert that our products and the methods we employ in the use of our products are covered by U.S. or foreign patents held by them. In addition, because patent applications can take many years to issue and because publication schedules for pending applications may vary by jurisdiction and some companies opt not to publish their patent applications, there may be applications now pending of which we are unaware and which may result in issued patents that our current or future products infringe or appear to infringe. Also, because the claims of published patent applications can change between publication and patent grant, there may be published patent applications that may ultimately issue with claims that we infringe. There could also be existing patents that one or more of our products or parts may infringe and of which we are unaware. As the number of competitors in the market for oxygen products and the number of patents issued in this area grows, the possibility of patent infringement claims against us increases. In certain situations, we may determine that it is in our best interests to voluntarily challenge a party’s patents in litigation or other proceedings, including patent reexaminations, or inter partes reviews. As a result, we may become involved in unwanted protracted litigation that could be costly, result in diversion of management’s attention, require us to pay damages and/or licensing royalties and force us to discontinue selling our products.
47
Infringement and other intellectual property claims and proceedings brought against us, whether successful or not, could result in substantial costs and harm to our reputation. Such claims and proceedings can also distract and divert management and key personnel from other tasks important to the success of the business. We cannot be certain that we will successfully defend against allegations of infringement of patents or other intellectual property rights. In the event that we become subject to a patent infringement or other intellectual property related lawsuit and if the asserted patents or other intellectual property were upheld as valid and enforceable and we were found to infringe the asserted patents or other intellectual property, or violate the terms of a license to which we are a party, we could be required to do one or more of the following:
|
|
• |
cease selling or using any of our products that incorporate the asserted intellectual property, which would adversely affect our revenue; |
|
|
• |
pay damages for past use of the asserted intellectual property, which may be substantial; |
|
|
• |
obtain a license from the holder of the asserted intellectual property, which license may not be available on reasonable royalty terms, if at all, and which could reduce profitability; and |
|
|
• |
redesign or rename, in the case of trademark claims, our products to avoid infringing the intellectual property rights of third parties, which may not be possible and could be costly and time-consuming if it is possible to do so. |
If we are unable to prevent unauthorized use or disclosure of trade secrets, unpatented know-how and other proprietary information, our ability to compete will be harmed.
We rely on a combination of trade secrets, copyrights, trademarks, confidentiality agreements and other contractual provisions and technical security measures to protect certain aspects of our technology, especially where we do not believe that patent protection is appropriate or obtainable. We require our employees and consultants to execute confidentiality agreements in connection with their employment or consulting relationships with us. We also require our employees and consultants to disclose and assign to us all inventions conceived during the term of their employment or engagement while using our property or that relate to our business. We also require our corporate partners, outside scientific collaborators and sponsored researchers, advisors and others with access to our confidential information to sign confidentiality agreements. We also have taken precautions to initiate reasonable safeguards to protect our information technology systems. However, these measures may not be adequate to safeguard our proprietary intellectual property and conflicts may, nonetheless, arise regarding ownership of inventions. Such conflicts may lead to the loss or impairment of our intellectual property or to expensive litigation to defend our rights against competitors who may be better funded and have superior resources. Our employees, consultants, contractors, outside clinical collaborators and other advisors may unintentionally or willfully disclose our confidential information to competitors. In addition, confidentiality agreements may be unenforceable or may not provide an adequate remedy in the event of unauthorized disclosure. Enforcing a claim that a third-party illegally obtained and is using our trade secrets is expensive and time-consuming, and the outcome is unpredictable. Moreover, our competitors may independently develop equivalent knowledge, methods and know-how. Unauthorized parties may also attempt to copy or reverse engineer certain aspects of our products that we consider proprietary, and in such cases we could not assert any trade secret rights against such party. As a result, other parties may be able to use our proprietary technology or information, and our ability to compete in the market would be harmed.
“Inogen,” “Inogen One,” “Inogen One G2,” “Inogen One G3,” “G4,” “G5,” “Oxygenation,” “Live Life in Moments, not Minutes,” “Never Run Out of Oxygen,” “Oxygen Therapy on Your Terms,” “Oxygen.Anytime.Anywhere,” “Reclaim Your Independence,” “Intelligent Delivery Technology,” “Inogen At Home,” and the Inogen design are registered and/or pending trademarks with the United States Patent and Trademark Office of Inogen, Inc. We own trademark registrations for the mark “Inogen” in Australia, Canada, South Korea, Mexico, Europe (European Union registration), and Japan. We own pending applications for the mark “Inogen” in Argentina, Brazil, China, and Ecuador, and an International Registration for the mark “Inogen” designating Colombia, Iceland, India, Israel, New Zealand, Norway, Singapore, Switzerland and Turkey. We own a trademark registration for the mark “イノジェン” in Japan. We own trademark applications for the marks “印诺真” and “艾诺根” in China. We own trademark registrations for the mark “Inogen One” in Australia, Canada, China, South Korea, Mexico, and Europe (European Union registration). We own a trademark registration for the mark “Satellite Conserver” in Canada. We own a trademark registration for the mark “Inogen At Home” in Europe (European Union Registration). We own trademark registrations for the mark “G4” in Europe (European Union registration) and the United Kingdom. We own trademark applications for the Inogen design in Bolivia and China. Other service marks, trademarks, and trade names referred to in this Annual Report on Form 10-K are the property of their respective owners.
48
We may be subject to damages resulting from claims that our employees, agents or we have wrongfully used or disclosed alleged trade secrets of other companies.
Some of our employees and consultants were previously employed by or contracted with other medical device companies focused on the development of oxygen therapy products, including our competitors. We may be subject to claims that these employees or agents have inadvertently or otherwise used or disclosed trade secrets or other proprietary information of their former employers. Litigation may be necessary to defend against these claims. If we fail in defending such claims, in addition to paying monetary damages, we may lose valuable intellectual property rights. Even if we are successful in defending against these claims, litigation could result in substantial costs, damage to our reputation and be a distraction to management.
Risks related to being a public company
We will incur increased costs as a result of operating as a public company and our management will be required to devote substantial time to new compliance initiatives and corporate governance practices.
As a public company, especially now that we are no longer an “emerging growth company,” we will continue to incur significant legal, accounting and other expenses that we did not incur as a private company. In addition, the Sarbanes-Oxley Act of 2002 and rules enforced by the Public Companies Oversight Board (PCAOB) subsequently implemented by the SEC and the NASDAQ Global Select Market impose numerous requirements on public companies, including establishment and maintenance of effective disclosure and financial controls and corporate governance practices. Also, the Securities Exchange Act of 1934, as amended, or the Exchange Act, requires, among other things, that we file annual, quarterly and current reports with respect to our business and operating results. Our management and other personnel will need to devote a substantial amount of time to compliance with these laws and regulations. These requirements have increased and will continue to increase our legal, accounting, external audit and financial compliance costs and have made and will continue to make some activities more time consuming and costly. For example, we expect these rules and regulations to make it more difficult and more expensive for us to obtain director and officer liability insurance, and we may be required to incur substantial costs to maintain the same or similar coverage. These rules and regulations could also make it more difficult for us to attract and retain qualified persons to serve on our board of directors or our board committees or as executive officers.
Overall, we estimate that our incremental costs resulting from operating as a public company, including compliance with these rules and regulations, may be between $1.5 million and $3.0 million per year. However, these rules and regulations are often subject to varying interpretations, in many cases due to their lack of specificity, and, as a result, their application in practice may evolve over time as new guidance is provided by regulatory and governing bodies and public accounting firms are subject to PCAOB compliance audits. This could result in continuing uncertainty regarding compliance matters and higher costs necessitated by ongoing revisions to disclosure and governance practices.
The Sarbanes-Oxley Act requires, among other things, that we assess and document the effectiveness of our internal control over financial reporting annually and the effectiveness of our disclosure controls and procedures quarterly. In particular, Section 404(a) of the Sarbanes-Oxley Act, or Section 404(a), requires us to perform system and process evaluation and testing of our internal control over financial reporting to allow management to report on the effectiveness of our internal control over financial reporting. Section 404(b) of Sarbanes-Oxley Act, or Section 404(b), also requires our independent registered public accounting firm to attest to the effectiveness of our internal control over financial reporting. Now that we are no longer an “emerging growth company,” our independent registered public accounting firm is required to undertake an assessment of our internal control over financial reporting, and the cost of our compliance with Section 404(b) is higher. Our compliance with applicable provisions of Section 404 will require that we incur substantial accounting expense and expend significant management time on compliance-related issues as we implement additional corporate governance practices and comply with reporting requirements.
Furthermore, investor perceptions of our company may suffer if deficiencies are found, and this could cause a decline in the market price of our stock. Irrespective of compliance with Section 404, any failure of our internal control over financial reporting could have a material adverse effect on our stated operating results and harm our reputation. If we are unable to implement these requirements effectively or efficiently, it could harm our operations, financial reporting, or financial results and could result in an adverse opinion on our internal controls from our independent registered public accounting firm.
49
Failure to maintain effective internal controls could cause our investors to lose confidence in us and adversely affect the market price of our common stock. If our internal controls are not effective, we may not be able to accurately report our financial results or prevent fraud.
Section 404 of the Sarbanes-Oxley Act, or Section 404, requires that we maintain internal control over financial reporting that meets applicable standards. We may err in the design, operation or documentation of our controls, and all internal control systems, no matter how well designed and operated, can provide only reasonable assurance that the objectives of the control system are met. Because there are inherent limitations in all control systems, there can be no absolute assurance that all control issues have been or will be detected. If we are unable, or are perceived as unable, to produce reliable financial reports due to internal control deficiencies, investors could lose confidence in our reported financial information and operating results, which could result in a negative market reaction.
We are required to disclose significant changes made in our internal controls and procedures on a quarterly basis. Now that we are no longer an “emerging growth company,” our independent registered public accounting firm is also required to attest to the effectiveness of our internal control over financial reporting pursuant to Section 404 of the Sarbanes-Oxley Act. Our independent registered public accounting firm may issue a report that is adverse in the event it is not satisfied with the level at which our controls are documented, designed or operating. Our remediation efforts may not enable us to avoid a material weakness in the future. Additionally, to comply with the requirements of being a public company, we may need to undertake various actions, such as implementing new internal controls and procedures and hiring accounting or internal audit staff, which may adversely affect our results of operations and financial condition.
Although prior material weaknesses have been remediated, we cannot assure you that our internal controls will continue to operate properly or that our financial statements will be free from error. There may be undetected material weaknesses in our internal control over financial reporting, as a result of which we may not detect financial statement errors on a timely basis. Moreover, in the future we may implement new offerings and engage in business transactions, such as acquisitions, reorganizations or implementation of new information systems that could require us to develop and implement new controls and could negatively affect our internal control over financial reporting and result in material weaknesses.
If we identify new material weaknesses in our internal control over financial reporting, if we are unable to comply with the requirements of Section 404 in a timely manner, if we are unable to assert that our internal controls over financial reporting are effective, or if our independent registered public accounting firm is unable to express an opinion as to the effectiveness of our internal control over financial reporting, we may be late with the filing of our periodic reports, investors may lose confidence in the accuracy and completeness of our financial reports and the market price of our common stock could be negatively affected. As a result of such failures, we could also become subject to investigations by the stock exchange on which our securities are listed, the SEC, or other regulatory authorities, and become subject to litigation from investors and stockholders, which could harm our reputation, financial condition or divert financial and management resources from our core business.
Risks related to our common stock
We expect that our stock price will fluctuate significantly, you may have difficulty selling your shares, and you could lose all or part of your investment.
Our stock is currently traded on NASDAQ, but we can provide no assurance that we will be able to maintain an active trading market on NASDAQ or any other exchange in the future. If an active trading market does not develop, you may have difficulty selling any of our shares of common stock that you buy. In addition, the trading price of our common stock may be highly volatile and could be subject to wide fluctuations in response to various factors, some of which are beyond our control. These factors include:
|
|
• |
actual or anticipated quarterly variation in our results of operations or the results of our competitors; |
|
|
• |
announcements of secondary offerings; |
|
|
• |
announcements by us or our competitors of new commercial products, significant contracts, commercial relationships or capital commitments; |
|
|
• |
issuance of new or changed securities analysts’ reports or recommendations for our stock; |
|
|
• |
developments or disputes concerning our intellectual property or other proprietary rights; |
|
|
• |
commencement of, or our involvement in, litigation; |
|
|
• |
market conditions in the oxygen therapy market; |
|
|
• |
reimbursement or legislative changes in the oxygen therapy market; |
50
|
|
• |
manufacturing disruptions that could occur if we were unable to successfully expand our production in our current or an alternative facility; |
|
|
• |
any future sales of our common stock or other securities; |
|
|
• |
any major change to the composition of our board of directors or management; |
|
|
• |
announcements by us or our competitors of significant acquisitions, strategic partnerships, joint ventures or capital commitments; |
|
|
• |
the other factors described in this “Risk Factors” section; and |
|
|
• |
general economic conditions and slow or negative growth of our markets. |
The stock market in general and market prices for the securities of technology-based companies like ours in particular, have from time to time experienced volatility that often has been unrelated to the operating performance of the underlying companies. These broad market and industry fluctuations may adversely affect the market price of our common stock, regardless of our operating performance. In several recent situations where the market price of a stock has been volatile, holders of that stock have instituted securities class action litigation against the company that issued the stock. If any of our stockholders were to bring a lawsuit against us, the defense and disposition of the lawsuit could be costly and divert the time and attention of our management and harm our operating results.
If securities or industry analysts do not publish research or publish unfavorable research about our business, our stock price and trading volume could decline.
The trading market for our common stock will rely in part on the research and reports that equity research analysts publish about us and our business. We will not have any control of the analysts or the content and opinions included in their reports. The price of our stock could decline if one or more equity research analysts downgrade our stock or issue other unfavorable commentary or research. If one or more equity research analysts ceases coverage of our company or fails to publish reports on us regularly, demand for our stock could decrease, which in turn could cause our stock price or trading volume to decline.
Future sales of shares could cause our stock price to decline.
Our stock price could decline as a result of sales of a large number of shares of our common stock or the perception that these sales could occur. These sales, or the possibility that these sales may occur, also might make it more difficult for us to sell equity securities in the future at a time and at a price that we deem appropriate.
As of December 31, 2018, one holder of approximately 3.5 million shares, or approximately 16.3%, of our outstanding shares, has rights, subject to some conditions, to require us to file registration statements covering the sale of their shares or to include their shares in registration statements that we may file for ourselves or other stockholders. We have also registered the offer and sale of all shares of common stock that we may issue under our equity compensation plans.
In addition, in the future, we may issue additional shares of common stock or other equity or debt securities convertible into common stock in connection with a financing, acquisition, litigation settlement, and employee arrangements or otherwise. Any such issuance could result in substantial dilution to our existing stockholders and could cause our stock price to decline.
Our directors, executive officers and principal stockholders will continue to have substantial control over us and could limit your ability to influence the outcome of key transactions, including changes of control.
As of December 31, 2018, our executive officers, directors and stockholders who owned more than 5% of our outstanding common stock and their respective affiliates beneficially owned or controlled approximately 58.1% of the outstanding shares of our common stock. Accordingly, these executive officers, directors and stockholders who owned more than 5% of our outstanding common stock and their respective affiliates, acting as a group, have substantial influence over the outcome of corporate actions requiring stockholder approval, including the election of directors, any merger, consolidation or sale of all or substantially all of our assets or any other significant corporate transactions. These stockholders may also delay or prevent a change of control of us, even if such a change of control would benefit our other stockholders. The significant concentration of stock ownership may adversely affect the trading price of our common stock due to investors’ perception that conflicts of interest may exist or arise.
51
Anti-takeover provisions in our charter documents and under Delaware law could make an acquisition of us, which may be beneficial to our stockholders, more difficult and may prevent attempts by our stockholders to replace or remove our current management and limit the market price of our common stock.
Provisions in our certificate of incorporation and bylaws may have the effect of delaying or preventing a change of control or changes in our management. Our amended and restated certificate of incorporation and amended and restated bylaws include provisions that:
|
|
• |
authorize our board of directors to issue, without further action by the stockholders, up to 10,000,000 shares of undesignated preferred stock; |
|
|
• |
require that any action to be taken by our stockholders be affected at a duly called annual or special meeting and not by written consent; |
|
|
• |
specify that special meetings of our stockholders can be called only by our board of directors, the Chairman of the board of directors, or the Chief Executive Officer; |
|
|
• |
establish an advance notice procedure for stockholder approvals to be brought before an annual meeting of our stockholders, including proposed nominations of persons for election to our board of directors; |
|
|
• |
establish that our board of directors is divided into three classes, Class I, Class II and Class III, with each class serving staggered three-year terms; |
|
|
• |
provide that our directors may be removed only for cause; |
|
|
• |
provide that vacancies on our board of directors may be filled only by a majority of directors then in office, even though less than a quorum; |
|
|
• |
specify that no stockholder is permitted to cumulate votes at any election of directors; and |
|
|
• |
require a super-majority of votes to amend certain of the above-mentioned provisions. |
These provisions may frustrate or prevent any attempts by our stockholders to replace or remove our current management by making it more difficult for stockholders to replace members of our board of directors, which is responsible for appointing the members of our management. In addition, because we are incorporated in Delaware, we are governed by the provisions of Section 203 of the Delaware General Corporation Law, which limits the ability of stockholders owning in excess of 15% of our outstanding voting stock to merge or combine with us.
We have never paid dividends on our capital stock, and we do not anticipate paying any cash dividends in the foreseeable future.
We have paid no cash dividends on any of our classes of capital stock to date and currently intend to retain our future earnings to fund the development and growth of our business. In addition, we may become subject to covenants under future debt arrangements that place restrictions on our ability to pay dividends. As a result, capital appreciation, if any, of our common stock is expected to be your sole source of gain for the foreseeable future.
ITEM 1B. UNRESOLVED STAFF COMMENTS
None.
As of December 31, 2018, we lease approximately 46,000 square feet of manufacturing and office space at our corporate headquarters in Goleta, California under leases that expire in October 2020; approximately 31,000 square feet of office space in Richardson, Texas under a lease that expires in December 2019; approximately 60,000 square feet of manufacturing and repair space in Richardson, Texas under leases that expire in January 2022 and March 2022; and approximately 72,000 square feet of office space in Cleveland, Ohio under a lease that expires in September 2024. In addition, we lease approximately 4,000 square feet of office space in Smyrna, Tennessee; Huntsville, Alabama; Aurora, Colorado; and Breukelen in the Netherlands with lease terms of 3 years. We also own land and office space in Manitowoc, Wisconsin. We believe that our existing facilities are adequate to meet our current business requirements and that if additional space is required, additional space will be available on commercially reasonable terms. In addition, we believe that our properties are in good condition and are adequate and suitable for their purposes.
52
In the normal course of business, we are from time to time involved in various legal proceedings or potential legal proceedings, including matters involving employment, product liability and intellectual property. We carry insurance, subject to specified deductibles under our policies, to protect against losses from certain types of legal claims. At this time, we do not anticipate that any of these proceedings will have a material adverse effect on our business. Regardless of the outcome, litigation can have an adverse impact on us because of defense and settlement costs, diversion of management resources, and other factors.
ITEM 4. MINE SAFETY DISCLOSURES
None.
53
ITEM 5. MARKET FOR REGISTRANT’S COMMON EQUITY, RELATED STOCKHOLDER MATTERS AND ISSUER PURCHASES OF EQUITY SECURITIES
Market information and holders
Our common stock has been publicly traded on the NASDAQ Global Select Market under the symbol “INGN” since February 14, 2014. Prior to that time, there was no public market for our common stock.
On February 22, 2019, the closing price for our common stock as reported on the NASDAQ Global Select Market was $143.33 per share.
Stock performance graph
This performance graph shall not be deemed “soliciting material” or to be “filed” with the SEC for purposes of Section 18 of the Exchange Act, or otherwise subject to the liabilities under that Section, and shall not be deemed to be incorporated by reference into any filing of ours under the Securities Act of 1933, as amended, except as shall be expressly set forth by specific reference in such filing.
The following graph compares the performance of our common stock for the periods indicated with the performance of the S & P Healthcare and Supplies Index, the Russell 2000 Index, and the NASDAQ Composite Index from February 14, 2014 to December 31, 2018. This graph assumes an investment of $100 on February 14, 2014 in each of our common stock, the NASDAQ Composite Index, the S & P Healthcare Equipment and Supplies Index, the Russell 2000 Index and assumes reinvestment of dividends, if any. The stock price performance shown on the graph below is not necessarily indicative of future stock price performance.
54
STOCKHOLDER RETURN PERFORMANCE GRAPH
COMPARISON OF THE YEARS CUMULATIVE TOTAL RETURN SINCE FEBRUARY 14, 2014
Among Inogen, Inc., the S & P Healthcare Equipment and Supplies Index, the Russell 2000 Index and the NASDAQ Composite Index
|
|
2/14/14 |
|
|
12/31/14 |
|
|
12/31/15 |
|
|
12/31/16 |
|
|
12/31/17 |
|
|
12/31/18 |
|
||||||
|
Inogen, Inc. |
$ |
100.00 |
|
|
$ |
207.06 |
|
|
$ |
264.62 |
|
|
$ |
443.37 |
|
|
$ |
800.79 |
|
|
$ |
819.60 |
|
|
S & P Healthcare Equipment & Supplies^(1) |
|
100.00 |
|
|
|
112.14 |
|
|
|
123.35 |
|
|
|
137.64 |
|
|
|
178.25 |
|
|
|
193.94 |
|
|
Russell 2000^(2) |
|
100.00 |
|
|
|
104.83 |
|
|
|
98.84 |
|
|
|
118.09 |
|
|
|
133.61 |
|
|
|
117.35 |
|
|
NASDAQ Composite^(3) |
|
100.00 |
|
|
|
111.59 |
|
|
|
117.99 |
|
|
|
126.84 |
|
|
|
162.66 |
|
|
|
156.34 |
|
|
(1) |
The S&P Healthcare Equipment and Supplies Index is a capitalization weighted-average index compiled of healthcare companies in the S&P 500 Index. |
|
(2) |
The Russell 2000 Index is a small-cap stock market index of the bottom 2,000 stocks in the Russell 3000 Index. |
|
(3) |
The NASDAQ Composite is a market-value weighted index of all common stocks listed on the NASDAQ. |
Stockholders
As of February 22, 2019, there were 24 registered stockholders of record for our common stock. The actual number of stockholders is greater than this number of record holders and includes stockholders who are beneficial owners but whose shares are held in street name by brokers and other nominees. This number of holders of record also does not include stockholders whose shares may be held in trust by other entities.
Dividend policy
We have never declared or paid any cash dividends on our common stock or any other securities. We anticipate that we will retain all available funds and any future earnings, if any, for use in the operation of our business and do not anticipate paying cash dividends in the foreseeable future. In addition, future debt instruments we issue may materially restrict our ability to pay dividends on our common stock. Payment of future cash dividends, if any, will be at the discretion of our board of directors after taking into account various factors, including our financial condition, operating results, current and anticipated cash needs, the requirements of then-existing debt instruments and other factors our board of directors deems relevant.
55
Securities authorized for issuance under equity compensation plans
The information required by this Item regarding equity compensation plans is incorporated by reference to the information set forth in PART III Item 12 of this Annual Report on Form 10-K.
Unregistered sales of equity securities
None.
Issuer purchases of equity securities
None.
ITEM 6. SELECTED FINANCIAL DATA
The following selected financial data is derived from our audited consolidated financial statements and should be read in conjunction with, and is qualified in its entirety by, Item 7, “Management’s Discussion and Analysis of Financial Condition and Results of Operations,” and Item 8, “Financial Statements and Supplementary Data,” contained elsewhere in this Annual Report on Form 10-K. The selected Condensed Consolidated Statements of Comprehensive Income data for the years ended December 31, 2018, 2017 and 2016 and Condensed Consolidated Balance Sheet Data as of December 31, 2018 and 2017 have been derived from our audited consolidated financial statements appearing elsewhere in this Annual Report on Form 10-K. The selected Condensed Consolidated Statements of Comprehensive Income data for the years ended December 31, 2015 and 2014 and Condensed Consolidated Balance Sheet data as of December 31, 2016, 2015 and 2014 have been derived from our audited consolidated financial statements that are not included in this Annual Report on Form 10-K. Our historical results are not necessarily indicative of the results that may be expected in the future.
|
(amounts in thousands) |
|
Years ended December 31, |
|
|||||||||||||||||
|
Condensed consolidated statements of comprehensive income |
|
2018 |
|
|
2017 |
|
|
2016 |
|
|
2015 |
|
|
2014 |
|
|||||
|
Revenue |
|
|
|
|
|
|
|
|
|
|
|
|
|
|
|
|
|
|
|
|
|
Sales revenue |
|
$ |
336,015 |
|
|
$ |
225,492 |
|
|
$ |
168,170 |
|
|
$ |
113,625 |
|
|
$ |
73,096 |
|
|
Rental revenue |
|
|
22,096 |
|
|
|
23,946 |
|
|
|
34,659 |
|
|
|
45,380 |
|
|
|
39,441 |
|
|
Total revenue |
|
|
358,111 |
|
|
|
249,438 |
|
|
|
202,829 |
|
|
|
159,005 |
|
|
|
112,537 |
|
|
Cost of revenue |
|
|
|
|
|
|
|
|
|
|
|
|
|
|
|
|
|
|
|
|
|
Cost of sales revenue |
|
|
163,989 |
|
|
|
110,163 |
|
|
|
85,154 |
|
|
|
61,553 |
|
|
|
38,693 |
|
|
Cost of rental revenue |
|
|
15,542 |
|
|
|
18,038 |
|
|
|
20,365 |
|
|
|
21,194 |
|
|
|
18,327 |
|
|
Total cost of revenue |
|
|
179,531 |
|
|
|
128,201 |
|
|
|
105,519 |
|
|
|
82,747 |
|
|
|
57,020 |
|
|
Gross profit |
|
|
178,580 |
|
|
|
121,237 |
|
|
|
97,310 |
|
|
|
76,258 |
|
|
|
55,517 |
|
|
Operating expenses |
|
|
|
|
|
|
|
|
|
|
|
|
|
|
|
|
|
|
|
|
|
Research and development |
|
|
7,029 |
|
|
|
5,313 |
|
|
|
5,113 |
|
|
|
4,180 |
|
|
|
2,977 |
|
|
Sales and marketing |
|
|
95,641 |
|
|
|
50,758 |
|
|
|
37,540 |
|
|
|
31,369 |
|
|
|
24,087 |
|
|
General and administrative |
|
|
38,018 |
|
|
|
37,576 |
|
|
|
31,793 |
|
|
|
25,658 |
|
|
|
17,942 |
|
|
Total operating expenses |
|
|
140,688 |
|
|
|
93,647 |
|
|
|
74,446 |
|
|
|
61,207 |
|
|
|
45,006 |
|
|
Income from operations |
|
|
37,892 |
|
|
|
27,590 |
|
|
|
22,864 |
|
|
|
15,051 |
|
|
|
10,511 |
|
|
Other income (expense), net |
|
|
2,563 |
|
|
|
2,066 |
|
|
|
(139 |
) |
|
|
(324 |
) |
|
|
(459 |
) |
|
Income before provision (benefit) for income taxes |
|
|
40,455 |
|
|
|
29,656 |
|
|
|
22,725 |
|
|
|
14,727 |
|
|
|
10,052 |
|
|
Provision (benefit) for income taxes |
|
|
(11,390 |
) |
|
|
8,654 |
|
|
|
2,206 |
|
|
|
3,142 |
|
|
|
3,226 |
|
|
Net income |
|
$ |
51,845 |
|
|
$ |
21,002 |
|
|
$ |
20,519 |
|
|
$ |
11,585 |
|
|
$ |
6,826 |
|
56
|
(amounts in thousands, except share and per share amounts) |
|
|
|
|
|
|
|
|
|
|
|
|
|
|
|
|
|
|
|
|
|
Reconciliation of net income to net income |
|
Years ended December 31, |
|
|||||||||||||||||
|
attributable to common stockholders - basic and diluted (1) |
|
2018 |
|
|
2017 |
|
|
2016 |
|
|
2015 |
|
|
2014 |
|
|||||
|
Numerator—basic: |
|
|
|
|
|
|
|
|
|
|
|
|
|
|
|
|
|
|
|
|
|
Net income |
|
$ |
51,845 |
|
|
$ |
21,002 |
|
|
$ |
20,519 |
|
|
$ |
11,585 |
|
|
$ |
6,826 |
|
|
Less deemed dividend on redeemable convertible preferred stock |
|
|
— |
|
|
|
— |
|
|
|
— |
|
|
|
— |
|
|
|
(987 |
) |
|
Net income after deemed dividend |
|
|
51,845 |
|
|
|
21,002 |
|
|
|
20,519 |
|
|
|
11,585 |
|
|
|
5,839 |
|
|
Less undistributed earnings to preferred stock - basic |
|
|
— |
|
|
|
— |
|
|
|
— |
|
|
|
— |
|
|
|
(567 |
) |
|
Net income attributable to common stockholders - basic |
|
$ |
51,845 |
|
|
$ |
21,002 |
|
|
$ |
20,519 |
|
|
$ |
11,585 |
|
|
$ |
5,272 |
|
|
Numerator—diluted: |
|
|
|
|
|
|
|
|
|
|
|
|
|
|
|
|
|
|
|
|
|
Net income |
|
$ |
51,845 |
|
|
$ |
21,002 |
|
|
$ |
20,519 |
|
|
$ |
11,585 |
|
|
$ |
6,826 |
|
|
Less deemed dividend on redeemable convertible preferred stock |
|
|
— |
|
|
|
— |
|
|
|
— |
|
|
|
— |
|
|
|
(987 |
) |
|
Net income after deemed dividend |
|
|
51,845 |
|
|
|
21,002 |
|
|
|
20,519 |
|
|
|
11,585 |
|
|
|
5,839 |
|
|
Less undistributed earnings to preferred stock - diluted |
|
|
— |
|
|
|
— |
|
|
|
— |
|
|
|
— |
|
|
|
(514 |
) |
|
Net income attributable to common stockholders - diluted |
|
$ |
51,845 |
|
|
$ |
21,002 |
|
|
$ |
20,519 |
|
|
$ |
11,585 |
|
|
$ |
5,325 |
|
|
Denominator: |
|
|
|
|
|
|
|
|
|
|
|
|
|
|
|
|
|
|
|
|
|
Weighted-average common shares - basic common stock |
|
|
21,266,696 |
|
|
|
20,683,807 |
|
|
|
20,067,152 |
|
|
|
19,398,991 |
|
|
|
16,182,569 |
|
|
Weighted-average common shares - diluted common stock |
|
|
22,514,513 |
|
|
|
21,897,988 |
|
|
|
21,095,867 |
|
|
|
20,708,170 |
|
|
|
18,037,498 |
|
|
Net income per share - basic common stock |
|
$ |
2.44 |
|
|
$ |
1.02 |
|
|
$ |
1.02 |
|
|
$ |
0.60 |
|
|
$ |
0.33 |
|
|
Net income per share - diluted common stock |
|
$ |
2.30 |
|
|
$ |
0.96 |
|
|
$ |
0.97 |
|
|
$ |
0.56 |
|
|
$ |
0.30 |
|
|
Shares excluded from diluted weighted-average |
|
|
|
|
|
|
|
|
|
|
|
|
|
|
|
|
|
|
|
|
|
common shares - diluted common stock: |
|
|
|
|
|
|
|
|
|
|
|
|
|
|
|
|
|
|
|
|
|
Stock options and other dilutive awards |
|
|
39,330 |
|
|
|
63,313 |
|
|
|
841,760 |
|
|
|
744,301 |
|
|
|
546,142 |
|
|
Shares excluded from diluted weighted-average common shares - diluted common stock |
|
|
39,330 |
|
|
|
63,313 |
|
|
|
841,760 |
|
|
|
744,301 |
|
|
|
546,142 |
|
|
(1) |
See Note 2 to each of our audited consolidated financial statements included elsewhere in this Annual Report on Form 10-K for an explanation of the calculations of our basic and diluted net income per share attributable to common stockholders. |
|
(amounts in thousands) |
|
As of December 31, |
|
|||||||||||||||||
|
Condensed consolidated balance sheet data |
|
2018 |
|
|
2017 |
|
|
2016 |
|
|
2015 |
|
|
2014 |
|
|||||
|
Cash and cash equivalents |
|
$ |
196,634 |
|
|
$ |
142,953 |
|
|
$ |
92,851 |
|
|
$ |
66,106 |
|
|
$ |
56,836 |
|
|
Working capital |
|
|
267,998 |
|
|
|
194,602 |
|
|
|
138,700 |
|
|
|
92,831 |
|
|
|
73,808 |
|
|
Total assets |
|
|
375,898 |
|
|
|
275,072 |
|
|
|
214,049 |
|
|
|
161,314 |
|
|
|
140,085 |
|
|
Total indebtedness |
|
|
— |
|
|
|
— |
|
|
|
— |
|
|
|
315 |
|
|
|
614 |
|
|
Deferred revenue |
|
|
16,295 |
|
|
|
12,935 |
|
|
|
9,281 |
|
|
|
6,522 |
|
|
|
4,492 |
|
|
Total liabilities |
|
|
65,474 |
|
|
|
48,031 |
|
|
|
31,961 |
|
|
|
27,296 |
|
|
|
21,935 |
|
|
Total stockholders' equity |
|
$ |
310,424 |
|
|
$ |
227,041 |
|
|
$ |
182,088 |
|
|
$ |
134,018 |
|
|
$ |
118,150 |
|
|
|
|
|
|
|
|
|
|
|
|
|
|
|
|
|
|
|
|
|
|
|
57
ITEM 7. MANAGEMENT’S DISCUSSION AND ANALYSIS OF FINANCIAL CONDITION AND RESULTS OF OPERATIONS
The following discussion and analysis of the financial condition and results of our operations should be read in conjunction with the consolidated financial statements and related notes included elsewhere in this Annual Report on Form 10-K. This discussion contains forward-looking statements that involve risks and uncertainties. Our actual results could differ materially from those discussed below. Factors that could cause or contribute to such differences include, but are not limited to, those identified below, and those discussed in the section titled “Risk Factors” included elsewhere in this Annual Report on Form 10-K.
Overview
We are a medical technology company that primarily develops, manufactures and markets innovative portable oxygen concentrators used to deliver supplemental long-term oxygen therapy to patients suffering from chronic respiratory conditions. Long-term oxygen therapy is defined as the provision of oxygen therapy for use at home in patients who have chronic low blood oxygen levels (hypoxemia). Traditionally, these patients have relied on stationary oxygen concentrator systems for use in the home and oxygen tanks or cylinders for mobile use, which we call the delivery model. The tanks and cylinders must be delivered regularly and have a finite amount of oxygen, which requires patients to plan activities outside of their homes around delivery schedules and a finite oxygen supply. Additionally, patients must attach long, cumbersome tubing to their stationary concentrators simply to enable mobility within their homes. Our proprietary Inogen One® systems concentrate the air around the patient to offer a single source of supplemental oxygen anytime, anywhere with a portable device weighing as little as approximately 2.8 pounds with a single battery. We believe our Inogen One systems reduce the patient’s reliance on stationary concentrators and scheduled deliveries of tanks with a finite supply of oxygen, thereby improving patient quality of life and fostering mobility.
In May 2004, we received 510(k) clearance from the U.S. Food and Drug Administration, or the FDA, for our Inogen One portable oxygen concentrator. From our launch of the Inogen One in 2004, through 2008, we derived our revenue almost exclusively from sales to healthcare providers and distributors. In December 2008, we acquired Comfort Life Medical Supply, LLC in order to secure access to the Medicare rental market and began accepting Medicare reimbursement for our oxygen solutions in certain states. At the time of the acquisition, Comfort Life Medical Supply, LLC had an active Medicare billing number but few other assets and limited business activities. In January 2009, following the acquisition of Comfort Life Medical Supply, LLC, we initiated our direct-to-consumer rental strategy and began renting Inogen One systems directly to patients and building our Medicare rental business in the United States. In April 2009, we became a Durable, Medical Equipment, Prosthetics, Orthotics, and Supplies accredited Medicare supplier by the Accreditation Commission for Health Care. We believe we were the first oxygen therapy manufacturer to employ a direct-to-consumer marketing strategy, meaning we advertise directly to patients, process their physician paperwork, and provide clinical support as needed, which we believe has contributed to our market leadership position in the portable oxygen concentrator market. While other manufacturers have also begun direct-to-consumer marketing campaigns to drive patient sales, we believe we are the only portable oxygen concentrator manufacturer that employs a direct-to-consumer rental strategy in the United States, meaning we bill Medicare or insurance on their behalf.
We derive the majority of our revenue from the sale and rental of our Inogen One systems and related accessories to patients, insurance carriers, home healthcare providers and distributors, including our private label partner. We sell multiple configurations of our Inogen One and Inogen At Home systems with various batteries, accessories, warranties, power cords and language settings. We also rent our products to Medicare beneficiaries and patients with other insurance coverage to support their long-term oxygen needs as prescribed by a physician as part of a care plan. Our goal is to design, build and market oxygen solutions that redefine how long-term oxygen therapy is delivered. To accomplish this goal and to grow our revenue, we intend to continue to:
58
We have been developing and refining the manufacturing of our Inogen One systems since 2004. While nearly all of our manufacturing and assembly processes were originally outsourced, assembly of the compressors, sieve beds, concentrators and certain manifolds were brought in-house in order to improve quality control and reduce cost. In support of our European sales, we established a physical presence in Europe by acquiring our former distributor, MedSupport Systems B.V. (MedSupport), on May 4, 2017 and began production of our Inogen One G3 concentrators in the fourth quarter of 2017 using a contract manufacturer, Foxconn, located in the Czech Republic to improve our ability to service our European customers. We expect to maintain our assembly operations for our Inogen One concentrators and Inogen At Home concentrators at our facilities in Richardson, Texas and Goleta, California. We expect this will allow us to expand our manufacturing capacity and redirect our U.S. manufacturing activities to focus on growth in the U.S. and on our latest product, the Inogen One G4, and on our upcoming launch of the Inogen One G5.
We also use lean manufacturing practices to maximize manufacturing efficiency. We rely on third-party manufacturers to supply several components of our Inogen One and Inogen At Home systems. We typically enter into supply agreements for these components that specify quantity and quality requirements and delivery terms. In certain cases, these agreements can be terminated by either party upon relatively short notice. We have elected to source certain key components from single sources of supply, including our batteries, motors, valves, and some molded plastic components. We believe that maintaining a single source of supply allows us to control production costs and inventory levels and to manage component quality. However, any reduction or halt in supply from one of these single-source suppliers could limit our ability to manufacture our products or devices until a replacement supplier is found and qualified.
Historically, we have generated a majority of our revenue from sales and rentals to customers in the United States. In the years ended December 31, 2018, 2017 and 2016, approximately 21.6%, 22.3% and 24.7%, respectively, of our total revenue was from sales to customers outside the United States, primarily in Europe. Approximately 74.8%, 73.5% and 70.6% of the non-U.S. revenue for the years ended December 31, 2018, 2017 and 2016, respectively, was invoiced in Euros with the remainder invoiced in United States dollars. We sell our products in 46 countries outside the United States through our wholly-owned subsidiary, distributors or directly to large “house” accounts, which include gas companies, HME oxygen providers, and resellers. In those instances, we sell to and bill the distributor or “house” accounts directly, leaving responsibility for the patient billing, support and clinical setup to the local provider.
59
Our total revenue was $358.1 million and $249.4 million in the years ended December 31, 2018 and 2017, respectively. The increase was primarily due to growth in sales revenue associated with the increases in direct-to-consumer and business-to-business sales of our Inogen One systems. Our total revenue was $249.4 million and $202.8 million in the years ended December 31, 2017 and 2016, respectively. The increase was primarily due to growth in sales revenue associated with the increases in business-to-business sales and direct-to-consumer sales of our Inogen One sales partially offset by a decline in rental revenue primarily associated with decreased reimbursement rates and a focus on sales instead of rentals. We generated net income of $51.8 million, $21.0 million and $20.5 million in the years ended December 31, 2018, 2017 and 2016, respectively. We generated Adjusted EBITDA of $61.3 million, $50.8 million and $43.4 million in the years ended December 31, 2018, 2017 and 2016, respectively (see “Non-GAAP financial measures” for reconciliations between U.S. GAAP and non-GAAP results). As of December 31, 2018, our retained earnings were $60.5 million.
Sales revenue
Our future financial performance will be driven in part by the growth in sales of our Inogen One systems, and, to a lesser extent, sales of batteries, other accessories, and sales of our Inogen At Home stationary oxygen concentrators. We plan to grow our system sales in the coming years through multiple strategies including: expanding our direct-to-consumer sales efforts through hiring additional sales representatives, investing in consumer awareness through increased marketing efforts, expanding our sales infrastructure and efforts outside of the United States, expanding our business-to-business sales through key partnerships, and enhancing our product offerings through additional product launches. As our product offerings grow, we solicit feedback from our customers and focus our research and development efforts on continuing to improve patient preference and reduce the total cost of the product in order to further drive sales of our products. For example, in the second quarter of 2018, we completed a direct-to-consumer pricing elasticity trial which indicated that by lowering our price we can expand access to our products and increase sales volumes while also improving our total gross margin profile. Accordingly, as of June 1, 2018, we reduced the starting retail minimum advertised price for our Inogen One G3 and Inogen One G4 systems.
Our direct-to-consumer sales process involves numerous interactions with the individual patient, the physician and the physician’s staff, and includes an in-depth analysis and review of our product, the patient’s diagnosis and prescribed oxygen therapy, including procuring an oxygen prescription. The patient may consider whether to finance the product through an Inogen-approved third-party or purchase the equipment. Product is not deployed until both the prescription and payment are received. Once a full system is deployed, the patient has 30 calendar days to return the product, subject to the payment of a minimal processing and handling fee. Approximately 7-14% of consumers who purchase a system return the system during this 30-day return period.
Our business-to-business efforts are focused on selling to distributors, HME oxygen providers, our private label partner and resellers, who are based inside and outside of the United States. This process involves interactions with various key customer stakeholders including sales, purchasing, product testing, and clinical personnel. Businesses that have patient demand that can be met with our oxygen concentrator systems place purchase orders to secure product deployment. This may be influenced based on outside factors, including the result of tender offerings, changes in insurance plan coverage, and overall changes in the net long-term oxygen therapy patient population. Products are shipped freight on board (FOB) Inogen dock domestically, and based on financial history and profile, businesses may either prepay or receive extended payment terms. Products are shipped both FOB Inogen dock and Delivery Duty Paid (DDP) for certain international shipments depending on the shipper used. DDP shipments are Inogen’s property until title has transferred which is upon duty being paid and delivered to the customer. As a result of these factors, product purchases can be subject to changes in demand by customers.
We sold approximately 198,600 systems in 2018, 128,000 systems in 2017 and 92,000 systems in 2016. Management focuses on system sales as an indicator of current business success.
Rental revenue
Our direct-to-consumer rental process involves numerous interactions with the individual patient, the physician and the physician’s staff. The process includes an in-depth analysis and review of our product, the patient’s diagnosis and prescribed oxygen therapy, and their medical history to confirm the appropriateness of our product for the patient’s oxygen therapy and compliance with Medicare and private payor billing requirements, which often necessitates additional physician evaluation and/or testing as well as a Certificate of Medical Necessity. Once the product is deployed, the patient receives direction on product use and may receive a clinical titration from our licensed staff to confirm the product meets the patient’s medical oxygen needs prior to billing. As a result, the time from initial contact with a patient to billing can vary significantly and be up to one month or longer.
60
We expect rental revenue to modestly increase in 2019 as compared to 2018. We plan to add new rental patients on service in future periods through multiple strategies, including expanding our direct-to-consumer marketing efforts while hiring additional sales representatives, investing in patient and physician awareness, and securing additional insurance contracts. However, insurance reimbursement rates are expected to decline. In addition, patients may come off our services due to death, a change in their condition, a change in location, a change in healthcare provider or other factors. In each case, we maintain asset ownership and can redeploy assets as appropriate following such events. Given the length and uncertainty of our patient acquisition cycle and potential returns we have experienced in the past, and likely will experience in the future, fluctuations in our net new patient setups will occur on a period-to-period basis and we may experience negative net patient additions in future periods. At this time, we do not plan to offer our Inogen One G4 system to rental patients but will continue to use the Inogen One G3 system as the primary ambulatory solution deployed in our rental fleet. We plan to use the Inogen One G5 system in our rental fleet once production of the Inogen One G3 system is discontinued.
A portion of rentals include a capped rental period during which no additional reimbursement is allowed unless additional criteria are met. In this scenario, the ratio of billable patients to total patients on service is critical to maintaining rental revenue growth as patients on service increases. Medicare has noted a certain percentage of beneficiaries, approximately 25%, based on their review of Medicare claims, reach the 36th month of eligible reimbursement and enter the capped rental period. Our capped patients as a percentage of total patients on service was approximately 19.1%, 17.0% and 17.1% as of December 31, 2018, 2017 and 2016, respectively. The percentage of capped patients may fluctuate over time as new patients come on service, patients come off of service before and during the capped rental period, and existing patients enter the capped rental period.
We had approximately 26,900, 30,700 and 33,300 oxygen rental patients as of December 31, 2018, 2017 and 2016, respectively. Management focuses on patients on service as a leading indicator of likely future rental revenue; however, actual rental revenue recognized is subject to a variety of other factors, including reimbursement levels by payor, patient location, the number of capped patients, write-offs for uncollectable balances, and rental revenue adjustments.
Reimbursement
We rely heavily on reimbursement from Medicare, and secondarily, from private payors, including Medicare Advantage plans, Medicaid and patients for our rental revenue. A discussion of third-party reimbursement is contained in Item 1, Third-party reimbursement in this Annual Report on Form 10-K.
For the years ended December 31, 2018, 2017 and 2016, approximately 78.0%, 73.0% and 72.6%, respectively, of our rental revenue was derived from Medicare’s service reimbursement programs. The U.S. list price for our stationary oxygen rentals (HCPCS E1390) is $260 per month and the U.S. list price for our oxygen generating portable equipment (OGPE) rentals (HCPCS E1392) is $70 per month. Effective January 1, 2017, the Medicare allowable for stationary oxygen rentals (E1390) ranges from $66.53 to $77.16 per month and the OGPE rentals (E1392) ranged from $36.14 to $41.91 per month. The average Medicare reimbursement rates in competitive bidding areas in 2018 were $77.03 a month for E1390 and $36.06 a month for E1392. These are the two primary codes that we bill to Medicare and other payors for our oxygen product rentals.
Basis of presentation
The following describes the line items set forth in our consolidated statements of comprehensive income.
Revenue
We classify our revenue in two main categories: sales revenue and rental revenue. There will be fluctuations in mix between business-to-business sales, direct-to-consumer sales and rental revenue from period-to-period. Inogen One and Inogen At Home system selling prices and gross margins may fluctuate as we introduce new products, reduce our product costs, have changes in purchase volumes, and as currency variations occur. For example, the gross margin for our Inogen One G4 system is higher than our Inogen One G3 system due to lower manufacturing costs and similar average selling prices. Thus, to the extent our sales of our Inogen One G4 systems are higher than sales of our Inogen One G3 systems, our overall gross margins should improve and, conversely, to the extent our sales of our Inogen One G3 systems are higher than sales of our Inogen One G4 systems, our overall gross margins should decline. Quarter-over-quarter results may vary due to seasonality in both the international and domestic markets (as discussed in Item 1. Seasonality and elsewhere in this Annual Report on Form 10-K.
61
Our sales revenue is primarily derived from the sale of our Inogen One systems, Inogen At Home systems, and related accessories to individual consumers, our private label partner, HME providers, distributors and resellers worldwide. Sales revenue is classified into two areas: business-to-business sales and direct-to-consumer sales. For the years ended December 31, 2018, 2017 and 2016, business-to-business sales as a percentage of total sales revenue were 57.7%, 61.6% and 63.5%, respectively. For the years ended December 31, 2018, 2017 and 2016, direct-to-consumer sales as a percentage of total sales revenue were 42.3%, 38.4% and 36.5%, respectively. Generally, our direct-to-consumer sales have higher gross margins than our business-to-business sales.
We also offer a lifetime warranty for direct-to-consumer sales of our portable oxygen concentrators. For a fixed price, we agree to provide a fully functional portable oxygen concentrator for the remaining life of the patient. Lifetime warranties are only offered to patients upon the initial sale of portable oxygen concentrators by the Company and are non-transferable. Lifetime warranties are considered to be a distinct performance obligation that are accounted for separately from the sale of portable oxygen concentrators with a standard warranty of three years.
The revenue is allocated to the distinct lifetime warranty performance obligation based on a relative stand-alone selling price (SSP) method. We have vendor-specific objective evidence of the selling price for our equipment. To determine the selling price of the lifetime warranty, we use our best estimate of the SSP for the distinct performance obligation as the lifetime warranty is neither separately priced nor is the selling price available through third-party evidence. To calculate the selling price associated with the lifetime warranties, management considers the profit margins of service revenue, the average estimated cost of lifetime warranties and the price of extended warranties. Revenue from the distinct lifetime warranty is deferred after the delivery of the equipment and recognized based on an estimated mortality rate over five years, which is the estimated performance period of the contract based on the average patient life expectancy.
Revenue from the sale of our repair services is recognized when the performance obligations are satisfied, and collection of the receivables is probable. Other revenue from sale of replacement parts is generally recognized when product is shipped to customers.
Rental revenue
Our rental revenue is primarily derived from the rental of our Inogen One and Inogen At Home systems to patients through reimbursement from Medicare, private payors and Medicaid, which typically also includes a patient responsibility component for patient co-insurance and deductibles. We expect our rental revenue to modestly increase in 2019, in spite of an additional 3.9% reduction in Medicare reimbursement rates for our products effective January 1, 2019. We also expect that our rental revenue will be impacted by the number of sales representatives, the level of and response from potential customers to direct-to-consumer marketing spend, product launches, and other uncontrollable factors such as changes in the market and competition.
We recognize equipment rental revenue over the non-cancelable lease term, which is one month, less estimated adjustments, in accordance with Accounting Standards Codification (ASC) 840 — Leases. We have a separate contract with each patient that is not subject to a master lease agreement with any payor. The lease term begins on the date products are shipped to patients and is recorded at amounts estimated to be received under reimbursement arrangements with third-party payors, including Medicare, private payors, and Medicaid. Due to the nature of the industry and the reimbursement environment in which we operate, certain estimates are required to record net revenue and accounts receivable at their net realizable values. Inherent in these estimates is the risk that they will have to be revised or updated as additional information becomes available. Specifically, the complexity of many third-party billing arrangements and the uncertainty of reimbursement amounts for certain services from certain payors may result in adjustments to amounts originally recorded. Such adjustments are typically identified and recorded at the point of cash application, claim denial or account review. Amounts billed but not earned due to the timing of the billing cycle are deferred and recognized in revenue on a straight-line basis over the monthly billing period. For example, if the first day of the billing period does not fall on the first of the month, then a portion of the monthly billing period will fall in the subsequent month and the related revenue and cost would be deferred based on the service days in the following month. Included in rental revenue are unbilled amounts for which the revenue recognition criteria had been met as of period-end but were not billed. The estimate of unbilled rental revenue accrual is reported net of adjustments that are based on historical trends and estimates of future collectability.
62
Cost of sales revenue
Cost of sales revenue consists primarily of costs incurred in the production process, including costs of component materials, assembly labor and overhead, warranty, provisions for slow-moving and obsolete inventory, rework and delivery costs for items sold. Labor and overhead expenses consist primarily of personnel-related expenses, including wages, bonuses, benefits, and stock-based compensation for manufacturing, logistics, repair and quality assurance employees, and temporary labor. They also include manufacturing freight in, depreciation expense, facilities costs and materials. We provide a 3-year, 5-year or lifetime warranty on Inogen One systems sold and a 3-year warranty on Inogen At Home systems sold. We established a reserve for the cost of future warranty repairs based on historical warranty repair costs incurred as well as historical failure rates. Provisions for warranty obligations, which are included in cost of sales revenue, are provided for at the time of revenue recognition.
We continue to make progress towards reducing the average unit costs of our Inogen One and Inogen At Home systems as a result of our ongoing efforts to develop lower-cost systems, negotiations with our suppliers, improvements in our manufacturing processes, and increased production volume and yields. In the second quarter of 2018, we also signed an additional lease in Richardson, Texas to expand our current manufacturing facilities by approximately 23,000 square feet to enable increased production volumes. At the same time, recent United States policies related to global trade and tariffs may also increase the Company’s average unit cost.
The current economic environment has introduced greater uncertainty with respect to potential trade regulations, including changes to United States policies related to global trade and tariffs. The Company continues to monitor the recently announced Section 301 tariffs being imposed by the United States on certain imported Chinese materials and products in addition to potential retaliatory responses from other nations. Following an analysis of the most recent tariff announcement, the Company currently expects the overall financial impact to our business to be a low single digit percentage increase to the average unit cost effective March 1, 2019. For these reasons, we expect sales gross margin percentage to fluctuate over time based on the sales channel mix, product mix, and changes in average selling prices and cost per unit.
Cost of rental revenue
Cost of rental revenue consists primarily of depreciation expense; service costs for rental patients, including rework costs, material, labor, freight, and consumable disposables; and logistics costs.
We expect rental gross margin percentage to increase in 2019 compared to 2018, primarily associated with higher rental revenue per patient. In addition, we expect the average cost of rental revenue per patient to decline in future periods as a result of our ongoing efforts to reduce average unit costs of our systems, including reductions in depreciation, service costs, and logistics costs.
Operating expense
Research and development
Our research and development expense consists primarily of personnel-related expenses, including wages, bonuses, benefits and stock-based compensation for research and development and engineering employees, allocated facility costs, laboratory supplies, product development materials, consulting fees and related costs, and testing costs for new product launches and enhancements to existing products. We have made substantial investments in research and development since our inception. Our research and development efforts have focused primarily on the tasks required to enhance our technologies and to support development and commercialization of new and existing products. We plan to continue to invest in research and development activities to stay at the forefront of patient preference in oxygen therapy devices. We expect research and development expense to increase in absolute dollars in future periods as we continue to invest in our engineering and technology teams to support our new and enhanced product research and development efforts and manufacturing line support.
Sales and marketing
Our sales and marketing expense primarily supports our direct-to-consumer marketing and rental strategy and consists mainly of personnel-related expenses, including wages, bonuses, commissions, benefits, and stock-based compensation for sales, marketing, customer service and clinical service employees. It also includes expenses for media and advertising, printing, informational kits, dues and fees, including credit card fees, sales promotional and marketing activities, travel and entertainment expenses as well as allocated facilities costs. Sales and marketing expense increased throughout 2018 and 2017, primarily due to an increase in the sales force and marketing expenses. We expect a further increase in future periods as we continue to invest in our business, including expanding our sales and sales support team, increasing media spend to drive consumer awareness, and increasing patient support costs as our patient
63
and customer base increases. We also opened a new facility in Cleveland, Ohio in the third quarter of 2017. In that facility, we expect to have approximately 500 employees by year-end 2019 with at least two-thirds of those employees expected to be sales representatives, which is expected to increase our sales and marketing costs. However, we are expecting to receive certain partially offsetting business development incentives of up to $3.5 million based on our forecasted headcount additions and facility tenant improvement costs. We also established a physical presence in Europe by acquiring MedSupport Systems B.V. on May 4, 2017. This acquisition has increased sales and marketing costs but has also improved customer service and repair services in the European markets.
General and administrative
Our general and administrative expense consists primarily of personnel-related expenses, including wages, bonuses, benefits, and stock-based compensation for employees in our compliance, finance, medical billing, human resources, and information technology departments as well as facilities costs, bad debt expense, and board of directors’ expenses, including stock-based compensation. In addition, general and administrative expense includes professional services, such as legal, patent registration and defense costs, insurance, consulting and accounting services, including audit and tax services, and travel and entertainment expenses.
We expect general and administrative expense to increase in future periods as the number of administrative personnel grows and we continue to introduce new products, broaden our customer base and grow our business. We expect general and administrative expense to increase in absolute dollars as we continue to invest in corporate infrastructure to support our growth including personnel-related expenses, professional services fees and compliance costs associated with operating as a public company. Those costs include increases in our accounting, human resources, and IT personnel, as well as increases in additional consulting, legal and accounting fees, insurance costs, and board members’ compensation.
Other income (expense), net
Our other income (expense), net consists primarily of interest income earned on cash equivalents and marketable securities as well as foreign currency gains and (losses).
Income taxes
We account for income taxes in accordance with ASC 740—Income Taxes. Under ASC 740, income taxes are recognized for the amount of taxes payable or refundable for the current period and deferred tax liabilities and assets are recognized for the future tax consequences of transactions that have been recognized in our consolidated financial statements or tax returns. A valuation allowance is provided when it is more likely than not that some portion, or all, of the deferred tax asset will not be realized.
We account for uncertainties in income tax in accordance with ASC 740-10—Accounting for Uncertainty in Income Taxes. ASC 740-10 prescribes a recognition threshold and measurement attribute for the financial statement recognition and measurement of a tax position taken or expected to be taken in a tax return. This accounting standard also provides guidance on derecognition, classification, interest and penalties, accounting in interim periods, disclosure and transition.
The accounting for stock-based compensation will increase or decrease our effective tax rate based upon the difference between our stock-based compensation expense and the deductions taken on our U.S. tax return, which depends upon the stock price at the time of employee option exercise or award vesting. We recognize excess tax benefits on a discrete basis and we anticipate our effective tax rate will vary from quarter-to-quarter depending on our stock price in each period.
Results of operations
Comparison of years ended December 31, 2018 and 2017
Revenue
|
|
|
Years ended December 31, |
|
|
Change 2018 vs. 2017 |
|
|
% of Revenue |
|
|||||||||||||||
|
(amounts in thousands) |
|
2018 |
|
|
2017 |
|
|
$ |
|
|
% |
|
|
2018 |
|
|
2017 |
|
||||||
|
Sales revenue |
|
$ |
336,015 |
|
|
$ |
225,492 |
|
|
$ |
110,523 |
|
|
|
49.0 |
% |
|
|
93.8 |
% |
|
|
90.4 |
% |
|
Rental revenue |
|
|
22,096 |
|
|
|
23,946 |
|
|
|
(1,850 |
) |
|
|
-7.7 |
% |
|
|
6.2 |
% |
|
|
9.6 |
% |
|
Total revenue |
|
$ |
358,111 |
|
|
$ |
249,438 |
|
|
$ |
108,673 |
|
|
|
43.6 |
% |
|
|
100.0 |
% |
|
|
100.0 |
% |
64
Sales revenue increased $110.5 million for the year ended December 31, 2018 from the year ended December 31, 2017, or an increase of 49.0% over the comparable year. The increase was primarily attributable to a 70,600-unit increase in the number of oxygen systems sold. We sold approximately 198,600 oxygen systems during the year ended December 31, 2018 compared to approximately 128,000 oxygen systems sold during the year ended December 31, 2017, or an increase of 55.2%. The increase in the number of systems sold resulted mainly from an increase in direct-to-consumer sales in the United States, primarily due to an increase in sales representatives as well as increased sales and marketing expenditures, and an increase in worldwide business-to-business sales, primarily due to traditional HME purchases and continued strong private label demand.
Rental revenue decreased $1.9 million for the year ended December 31, 2018 from the year ended December 31, 2017, or a decrease of 7.7% from the comparable year. The decrease in rental revenue was primarily related to a decline in rental patients on service which decreased 12.4% from the comparative period. The year ended December 31, 2017 also included $0.2 million of additional revenue associated with the Cures Act that did not repeat in the year ended December 31, 2018.
|
(amounts in thousands) |
|
Years ended December 31, |
|
|
Change 2018 vs. 2017 |
|
|
% of Revenue |
|
|||||||||||||||
|
|
2018 |
|
|
2017 |
|
|
$ |
|
|
% |
|
|
2018 |
|
|
2017 |
|
|||||||
|
Business-to-business domestic sales |
|
$ |
116,581 |
|
|
$ |
83,390 |
|
|
$ |
33,191 |
|
|
|
39.8 |
% |
|
|
32.5 |
% |
|
|
33.4 |
% |
|
Business-to-business international sales |
|
|
77,333 |
|
|
|
55,519 |
|
|
|
21,814 |
|
|
|
39.3 |
% |
|
|
21.6 |
% |
|
|
22.3 |
% |
|
Direct-to-consumer domestic sales |
|
|
142,101 |
|
|
|
86,583 |
|
|
|
55,518 |
|
|
|
64.1 |
% |
|
|
39.7 |
% |
|
|
34.7 |
% |
|
Direct-to-consumer domestic rentals |
|
|
22,096 |
|
|
|
23,946 |
|
|
|
(1,850 |
) |
|
|
-7.7 |
% |
|
|
6.2 |
% |
|
|
9.6 |
% |
|
Total revenue |
|
$ |
358,111 |
|
|
$ |
249,438 |
|
|
$ |
108,673 |
|
|
|
43.6 |
% |
|
|
100.0 |
% |
|
|
100.0 |
% |
Domestic sales in direct-to-consumer and business-to-business channels increased 64.1% and 39.8%, respectively, for the year ended December 31, 2018 compared to the year ended December 31, 2017. The increase in direct-to-consumer sales was primarily due to the hiring of additional inside sales representatives, increased marketing expenditures, our expansion of marketing strategies, and our continued focus on direct-to-consumer sales. We also benefited from increased direct-to-consumer sales associated with the direct-to-consumer pricing trial and subsequent lowering of retail pricing, effective June 1, 2018. The increase in domestic business-to-business sales was primarily the result of increased demand from our private label partner and traditional HME providers as well as increased consumer demand for our products due to our marketing efforts as well as the marketing efforts of our business partners.
Business-to-business international sales increased 39.3% for the year ended December 31, 2018 compared to the year ended December 31, 2017, primarily due to increases in sales from our partners in Europe and favorable currency exchange rates. We sell our products in 46 countries outside of the United States, and we plan to continue to expand our presence in other countries as the opportunities present themselves. Of our international sales revenue in the year ended December 31, 2018, 88.3% was sold in Europe versus 84.7% in the comparative period in 2017, primarily because of the increase in sales to our partners in Europe. We also acquired MedSupport in the second quarter of 2017, which also contributed to increased international revenues in the year ended December 31, 2018.
Cost of revenue and gross profit
|
|
|
Years ended December 31, |
|
|
Change 2018 vs. 2017 |
|
|
% of Revenue |
|
|||||||||||||||
|
(amounts in thousands) |
|
2018 |
|
|
2017 |
|
|
$ |
|
|
% |
|
|
2018 |
|
|
2017 |
|
||||||
|
Cost of sales revenue |
|
$ |
163,989 |
|
|
$ |
110,163 |
|
|
$ |
53,826 |
|
|
|
48.9 |
% |
|
|
45.8 |
% |
|
|
44.2 |
% |
|
Cost of rental revenue |
|
|
15,542 |
|
|
|
18,038 |
|
|
|
(2,496 |
) |
|
|
-13.8 |
% |
|
|
4.3 |
% |
|
|
7.2 |
% |
|
Total cost of revenue |
|
$ |
179,531 |
|
|
$ |
128,201 |
|
|
$ |
51,330 |
|
|
|
40.0 |
% |
|
|
50.1 |
% |
|
|
51.4 |
% |
|
|
|
|
|
|
|
|
|
|
|
|
|
|
|
|
|
|
|
|
|
|
|
|
|
|
|
Gross profit - sales revenue |
|
$ |
172,026 |
|
|
$ |
115,329 |
|
|
$ |
56,697 |
|
|
|
49.2 |
% |
|
|
48.0 |
% |
|
|
46.2 |
% |
|
Gross profit - rental revenue |
|
|
6,554 |
|
|
|
5,908 |
|
|
|
646 |
|
|
|
10.9 |
% |
|
|
1.9 |
% |
|
|
2.4 |
% |
|
Total gross profit |
|
$ |
178,580 |
|
|
$ |
121,237 |
|
|
$ |
57,343 |
|
|
|
47.3 |
% |
|
|
49.9 |
% |
|
|
48.6 |
% |
|
|
|
|
|
|
|
|
|
|
|
|
|
|
|
|
|
|
|
|
|
|
|
|
|
|
|
Gross margin percentage - sales revenue |
|
|
51.2 |
% |
|
|
51.1 |
% |
|
|
|
|
|
|
|
|
|
|
|
|
|
|
|
|
|
Gross margin percentage- rental revenue |
|
|
29.7 |
% |
|
|
24.7 |
% |
|
|
|
|
|
|
|
|
|
|
|
|
|
|
|
|
|
Total gross margin percentage |
|
|
49.9 |
% |
|
|
48.6 |
% |
|
|
|
|
|
|
|
|
|
|
|
|
|
|
|
|
65
We manufacture our subassemblies and/or products in our Richardson, Texas and Goleta, California facilities. We also began production of our Inogen One G3 concentrators in the fourth quarter of 2017 using a contract manufacturer, Foxconn, located in the Czech Republic to improve our ability to service our European customers. Our manufacturing process includes final assembly, testing, and packaging to quality and customer specifications. Cost of sales revenue increased $53.8 million for the year ended December 31, 2018 from the year ended December 31, 2017, or an increase of 48.9% over the comparable year. The increase in cost of sales revenue was primarily attributable to an increase in the number of systems sold, partially offset by reduced bill of material costs for our products associated with design changes, better sourcing and price discounts resulting from increased volumes. We expect cost of sales revenue as a percentage of sales revenue in future periods to fluctuate based on customer mix, product mix, and changes in sales prices and cost per unit.
Cost of rental revenue decreased $2.5 million for the year ended December 31, 2018 from the year ended December 31, 2017, or a decrease of 13.8% from the comparable year. The decrease in cost of rental revenue was primarily attributable to a decrease in rental asset depreciation expense. Cost of rental revenue included $7.6 million of rental asset depreciation for the year ended December 31, 2018 and $9.8 million for the year ended December 31, 2017.
Gross margin percentage is defined as revenue less costs of revenue divided by revenue. Sales revenue gross margin percentage slightly increased to 51.2% for the year ended December 31, 2018 from 51.1% for the year ended December 31, 2017. The increase in sales gross margin percentage was primarily related to an increase in sales mix toward higher margin domestic direct-to-consumer sales and lower cost per unit, partially offset by a reduction in domestic business-to-business average selling prices based on price discounts associated with increased volumes and lower direct-to-consumer pricing. Average business-to-business selling prices declined over the same period in the prior year, primarily due to mix related to increased volume from our private label partner and secondarily associated with pricing discounts associated with increased volumes worldwide. Total worldwide business-to-business sales revenue accounted for 57.7% of total sales revenue in the year ended December 31, 2018 versus 61.6% in the year ended December 31, 2017. We expect sales gross margin to fluctuate over time based on changes in the sales channel mix, product mix, average selling prices and cost per unit.
Rental revenue gross margin percentage increased to 29.7% for the year ended December 31, 2018 from 24.7% for the year ended December 31, 2017, primarily due to lower depreciation costs.
Research and development expense
|
|
|
Years ended December 31, |
|
|
Change 2018 vs. 2017 |
|
|
% of Revenue |
|
|||||||||||||||
|
(amounts in thousands) |
|
2018 |
|
|
2017 |
|
|
$ |
|
|
% |
|
|
2018 |
|
|
2017 |
|
||||||
|
|
$ |
7,029 |
|
|
$ |
5,313 |
|
|
$ |
1,716 |
|
|
|
32.3 |
% |
|
|
2.0 |
% |
|
|
2.1 |
% |
|
Research and development expense increased $1.7 million for the year ended December 31, 2018 from the year ended December 31, 2017, or an increase of 32.3% over the prior year, primarily due to a $1.2 million increase in personnel-related expenses and a $0.3 million increase in product development expenses for engineering projects.
Sales and marketing expense
|
|
|
Years ended December 31, |
|
|
Change 2018 vs. 2017 |
|
|
% of Revenue |
|
|||||||||||||||
|
(amounts in thousands) |
|
2018 |
|
|
2017 |
|
|
$ |
|
|
% |
|
|
2018 |
|
|
2017 |
|
||||||
|
|
$ |
95,641 |
|
|
$ |
50,758 |
|
|
$ |
44,883 |
|
|
|
88.4 |
% |
|
|
26.7 |
% |
|
|
20.3 |
% |
|
Sales and marketing expense increased $44.9 million for the year ended December 31, 2018 from the year ended December 31, 2017, or an increase of 88.4% over the comparable year. The increase was primarily attributable to increases of $20.8 million of sales and marketing personnel-related expenses as a result of the increased headcount (which included increases of $11.8 million in wages, benefits and payroll tax expense, $6.8 million in commissions expense, $1.0 million in bonus expense, $0.8 million in stock compensation expense, and $0.3 million in recruiting and relocation expense), $18.2 million in media spending to supply leads for the increased number of sales force headcount hired, $2.2 million in credit card processing fees, $1.5 million in customer service and clinical personnel-related expenses, $1.5 million in dues, fees and license costs and $0.6 million in facilities costs. In the year ended December 31, 2018, we spent $30.8 million in media and advertising costs versus $12.5 million in the comparative period in 2017.
66
General and administrative expense
|
|
|
Years ended December 31, |
|
|
Change 2018 vs. 2017 |
|
|
% of Revenue |
|
|||||||||||||||
|
(amounts in thousands) |
|
2018 |
|
|
2017 |
|
|
$ |
|
|
% |
|
|
2018 |
|
|
2017 |
|
||||||
|
General and administrative expense |
|
$ |
38,018 |
|
|
$ |
37,576 |
|
|
$ |
442 |
|
|
|
1.2 |
% |
|
|
10.6 |
% |
|
|
15.1 |
% |
General and administrative expense increased $0.4 million for the year ended December 31, 2018 from the year ended December 31, 2017, or an increase of 1.2% over the comparable year. The increase was primarily attributable to $4.0 million of personnel-related expenses (which included increases of $1.9 million in wages, benefits and payroll tax expense, $1.8 million in stock compensation expense, and $0.3 million in bonus expense), $0.7 million in executive officer transition costs, $0.7 million of increased amortization expense, $0.4 million for depreciation expense, $0.4 million in office expense and supplies, and $0.3 million in fees and licensing. These increases were partially offset by decreases of $4.0 million of patent defense costs and $2.2 million of bad debt expense as well as a $0.4 million increase in net proceeds from the sale of former assets.
Bad debt expense, expressed as a percentage of total revenue, was 0.5% and 1.5% in the years ended December 31, 2018 and 2017, respectively, due to lower write-offs on rental patient obligations.
Other income (expense), net
|
|
|
Years ended December 31, |
|
|
Change 2018 vs. 2017 |
|
|
% of Revenue |
|
|||||||||||||||
|
(amounts in thousands) |
|
2018 |
|
|
2017 |
|
|
$ |
|
|
% |
|
|
2018 |
|
|
2017 |
|
||||||
|
Interest income |
|
|
3,259 |
|
|
|
765 |
|
|
|
2,494 |
|
|
|
326.0 |
% |
|
|
0.9 |
% |
|
|
0.3 |
% |
|
Other income (expense) |
|
|
(696 |
) |
|
|
1,301 |
|
|
|
(1,997 |
) |
|
|
-153.5 |
% |
|
|
-0.2 |
% |
|
|
0.5 |
% |
|
Total other income, net |
|
$ |
2,563 |
|
|
$ |
2,066 |
|
|
$ |
497 |
|
|
|
24.1 |
% |
|
|
0.7 |
% |
|
|
0.8 |
% |
Total other income (expense), net, increased $0.5 million for the year ended December 31, 2018 from the year ended December 31, 2017, or an increase of 24.1% over the comparable year. An increase of $2.5 million in interest income on cash equivalents and marketable securities was offset by a decrease of $2.0 million in other income (expense) related to net foreign currency losses arising from increased transactions in Euros at a lower Euro exchange rate to the U.S. dollar compared to net foreign currency gains recorded in the comparable year.
Income tax expense (benefit)
|
|
|
Years ended December 31, |
|
|
Change 2018 vs. 2017 |
|
|
% of Revenue |
|
|||||||||||||||
|
(amounts in thousands) |
|
2018 |
|
|
2017 |
|
|
$ |
|
|
% |
|
|
2018 |
|
|
2017 |
|
||||||
|
Income tax expense (benefit) |
|
$ |
(11,390 |
) |
|
$ |
8,654 |
|
|
$ |
(20,044 |
) |
|
|
-231.6 |
% |
|
|
-3.2 |
% |
|
|
3.5 |
% |
|
Effective income tax rate |
|
|
-28.2 |
% |
|
|
29.2 |
% |
|
|
|
|
|
|
|
|
|
|
|
|
|
|
|
|
Income tax expense (benefit) decreased $20.0 million for the year ended December 31, 2018 from the year ended December 31, 2017, primarily attributable to an increase of excess benefits recognized from stock-based compensation and the impact of changes in the federal tax rate associated with the Tax Cuts and Jobs Act (TCJA), partially offset by a 36.4% increase in income before income tax expense (benefit).
Our effective tax rate in the year ended December 31, 2018 decreased compared to 2017, primarily due to the changes in the federal tax rate associated with the TCJA. In the year ended December 31, 2018, excess tax benefits recognized from stock-based compensation decreased our income tax expense by $21.2 million and our effective tax rate by 52.5%, as compared to the tax rate without such benefits. For comparison, in the year ended December 31, 2017, excess tax benefits recognized from stock-based compensation decreased our income tax expense by $9.9 million and our effective tax rate by 33.5%, as compared to the tax rate without such benefits.
Net income
|
|
|
Years ended December 31, |
|
|
Change 2018 vs. 2017 |
|
|
% of Revenue |
|
|||||||||||||||
|
(amounts in thousands) |
|
2018 |
|
|
2017 |
|
|
$ |
|
|
% |
|
|
2018 |
|
|
2017 |
|
||||||
|
Net income |
|
$ |
51,845 |
|
|
$ |
21,002 |
|
|
$ |
30,843 |
|
|
|
146.9 |
% |
|
|
14.5 |
% |
|
|
8.4 |
% |
67
Net income increased $30.8 million for the year ended December 31, 2018 from the year ended December 31, 2017, or an increase of 146.9% over the comparable year. The increase in net income was primarily related to the increase in revenues of 43.6% and a lower effective tax rate.
Seasonality
We believe our sales may be impacted by seasonal factors. For example, we typically experience higher total sales in the second and third quarters, as a result of consumers traveling and vacationing during warmer weather in the spring and summer months, but this may vary year-over-year. As more HME providers adopt portable oxygen concentrators in their businesses, we expect that this could change our historical seasonality in the domestic business-to-business channel, which was previously influenced mainly by consumer buying patterns. Direct-to-consumer sales seasonality may also be impacted by the number of sales representatives and the amount of marketing spend in each quarter.
The following tables set forth our unaudited quarterly consolidated statements of comprehensive income data for each of the eight quarters in the period ended December 31, 2018. We have prepared the quarterly statements of income data on a basis consistent with the audited consolidated financial statements included in Part II, Item 8, "Financial Statements and Supplementary Data" in this Annual Report on Form 10-K. In the opinion of management, the financial information reflects all adjustments, consisting only of normal recurring adjustments, which we consider necessary for a fair presentation of this data. This information should be read in conjunction with the audited consolidated financial statements and related notes included in Part II, Item 8, "Financial Statements and Supplementary Data" in this Annual Report on Form 10-K. The results of historical periods are not necessarily indicative of the results of operations for any future period.
|
(amounts in thousands, except share and per share amounts) |
|
|
|
|
|
|
|
|
|
|
|
|
|
|
|
|
|
Quarterly Results 2018 |
|
Q1 March |
|
|
Q2 June |
|
|
Q3 September |
|
|
Q4 December |
|
||||
|
Total revenue |
|
$ |
79,051 |
|
|
$ |
97,238 |
|
|
$ |
95,291 |
|
|
$ |
86,531 |
|
|
Gross profit |
|
|
37,727 |
|
|
|
48,470 |
|
|
|
48,813 |
|
|
|
43,570 |
|
|
Income before benefit for income taxes |
|
|
9,687 |
|
|
|
13,646 |
|
|
|
11,299 |
|
|
|
5,823 |
|
|
Benefit for income taxes |
|
|
(1,071 |
) |
|
|
(964 |
) |
|
|
(5,133 |
) |
|
|
(4,222 |
) |
|
Net income |
|
|
10,758 |
|
|
|
14,610 |
|
|
|
16,432 |
|
|
|
10,045 |
|
|
Net income per share attributable to |
|
|
|
|
|
|
|
|
|
|
|
|
|
|
|
|
|
common stockholders: |
|
|
|
|
|
|
|
|
|
|
|
|
|
|
|
|
|
Basic |
|
$ |
0.51 |
|
|
$ |
0.69 |
|
|
$ |
0.77 |
|
|
$ |
0.47 |
|
|
Diluted |
|
$ |
0.48 |
|
|
$ |
0.65 |
|
|
$ |
0.73 |
|
|
$ |
0.44 |
|
|
Weighted-average number of shares used in |
|
|
|
|
|
|
|
|
|
|
|
|
|
|
|
|
|
calculating net income per share attributable |
|
|
|
|
|
|
|
|
|
|
|
|
|
|
|
|
|
to common stockholders: |
|
|
|
|
|
|
|
|
|
|
|
|
|
|
|
|
|
Basic common shares |
|
|
21,026,154 |
|
|
|
21,172,170 |
|
|
|
21,324,256 |
|
|
|
21,544,202 |
|
|
Diluted common shares |
|
|
22,295,213 |
|
|
|
22,503,749 |
|
|
|
22,659,052 |
|
|
|
22,600,038 |
|
|
(amounts in thousands, except share and per share amounts) |
|
|
|
|
|
|
|
|
|
|
|
|
|
|
|
|
|
Quarterly Results 2017 |
|
Q1 March |
|
|
Q2 June |
|
|
Q3 September |
|
|
Q4 December |
|
||||
|
Total revenue |
|
$ |
52,500 |
|
|
$ |
64,121 |
|
|
$ |
69,030 |
|
|
$ |
63,787 |
|
|
Gross profit |
|
|
25,744 |
|
|
|
31,567 |
|
|
|
33,170 |
|
|
|
30,756 |
|
|
Income before provision (benefit) for income taxes |
|
|
5,879 |
|
|
|
9,166 |
|
|
|
8,817 |
|
|
|
5,794 |
|
|
Provision (benefit) for income taxes |
|
|
(53 |
) |
|
|
828 |
|
|
|
1,479 |
|
|
|
6,400 |
|
|
Net income (loss) |
|
|
5,932 |
|
|
|
8,338 |
|
|
|
7,338 |
|
|
|
(606 |
) |
|
Net income (loss) per share attributable to |
|
|
|
|
|
|
|
|
|
|
|
|
|
|
|
|
|
common stockholders: |
|
|
|
|
|
|
|
|
|
|
|
|
|
|
|
|
|
Basic |
|
$ |
0.29 |
|
|
$ |
0.40 |
|
|
$ |
0.35 |
|
|
$ |
(0.03 |
) |
|
Diluted |
|
$ |
0.27 |
|
|
$ |
0.38 |
|
|
$ |
0.33 |
|
|
$ |
(0.03 |
) |
|
Weighted-average number of shares used in |
|
|
|
|
|
|
|
|
|
|
|
|
|
|
|
|
|
calculating net income (loss) per share attributable |
|
|
|
|
|
|
|
|
|
|
|
|
|
|
|
|
|
to common stockholders: |
|
|
|
|
|
|
|
|
|
|
|
|
|
|
|
|
|
Basic common shares |
|
|
20,489,532 |
|
|
|
20,622,320 |
|
|
|
20,753,789 |
|
|
|
20,869,589 |
|
|
Diluted common shares |
|
|
21,579,721 |
|
|
|
21,848,359 |
|
|
|
21,998,660 |
|
|
|
22,167,358 |
|
68
Comparison of years ended December 31, 2017 and 2016
Revenue
|
|
|
Years ended December 31, |
|
|
Change 2017 vs. 2016 |
|
|
% of Revenue |
|
|||||||||||||||
|
(amounts in thousands) |
|
2017 |
|
|
2016 |
|
|
$ |
|
|
% |
|
|
2017 |
|
|
2016 |
|
||||||
|
Sales revenue |
|
$ |
225,492 |
|
|
$ |
168,170 |
|
|
$ |
57,322 |
|
|
|
34.1 |
% |
|
|
90.4 |
% |
|
|
82.9 |
% |
|
Rental revenue |
|
|
23,946 |
|
|
|
34,659 |
|
|
|
(10,713 |
) |
|
|
-30.9 |
% |
|
|
9.6 |
% |
|
|
17.1 |
% |
|
Total revenue |
|
$ |
249,438 |
|
|
$ |
202,829 |
|
|
$ |
46,609 |
|
|
|
23.0 |
% |
|
|
100.0 |
% |
|
|
100.0 |
% |
Sales revenue increased $57.3 million for the year ended December 31, 2017 from the year ended December 31, 2016, or an increase of 34.1% over the comparable period. The increase was primarily attributable to a 36,000-unit increase in the number of oxygen systems sold. We sold approximately 128,000 oxygen systems during the year ended December 31, 2017 compared to approximately 92,000 oxygen systems sold during the year ended December 31, 2016, or an increase of 39.1%. The increase in the number of systems sold resulted mainly from an increase in worldwide business-to-business sales, primarily due to traditional HME purchases and continued strong private label demand, and an increase in direct-to-consumer sales in the United States, mainly due to an increase in sales representatives and an increase in productivity, as well as increased sales and marketing efforts.
Rental revenue decreased $10.7 million for the year ended December 31, 2017 from the year ended December 31, 2016, or a decrease of 30.9% from the comparable period. The decrease in rental revenue was primarily related to the decline in rental patients on service, reduction in Medicare reimbursement rates that took effect in the first quarter of 2017 and declines in private-payor rates which decreased reimbursements in response to lower Medicare rates.
|
(amounts in thousands) |
|
Years ended December 31, |
|
|
Change 2017 vs. 2016 |
|
|
% of Revenue |
|
|||||||||||||||
|
Revenue by region and category |
|
2017 |
|
|
2016 |
|
|
$ |
|
|
% |
|
|
2017 |
|
|
2016 |
|
||||||
|
Business-to-business domestic sales |
|
$ |
83,390 |
|
|
$ |
56,605 |
|
|
$ |
26,785 |
|
|
|
47.3 |
% |
|
|
33.4 |
% |
|
|
27.9 |
% |
|
Business-to-business international sales |
|
|
55,519 |
|
|
|
50,106 |
|
|
|
5,413 |
|
|
|
10.8 |
% |
|
|
22.3 |
% |
|
|
24.7 |
% |
|
Direct-to-consumer domestic sales |
|
|
86,583 |
|
|
|
61,459 |
|
|
|
25,124 |
|
|
|
40.9 |
% |
|
|
34.7 |
% |
|
|
30.3 |
% |
|
Direct-to-consumer domestic rentals |
|
|
23,946 |
|
|
|
34,659 |
|
|
|
(10,713 |
) |
|
|
-30.9 |
% |
|
|
9.6 |
% |
|
|
17.1 |
% |
|
Total revenue |
|
$ |
249,438 |
|
|
$ |
202,829 |
|
|
$ |
46,609 |
|
|
|
23.0 |
% |
|
|
100.0 |
% |
|
|
100.0 |
% |
Domestic sales in business-to-business and direct-to-consumer increased 47.3% and 40.9%, respectively, for the year ended December 31, 2017 compared to the year ended December 31, 2016. The increase in domestic business-to-business sales was primarily the result of increased demand from our traditional HME providers and private label partner and increased consumer demand for our products due to our marketing efforts as well as the marketing efforts of our business partners. The increase in direct-to-consumer sales was primarily due to the hiring of additional internal sales representatives, increased productivity, increased marketing expenditures, our expansion of marketing strategies, and our continued focus on direct-to-consumer sales with more selective new rental patient set-ups.
Business-to-business international sales increased 10.8% for the year ended December 31, 2017 compared to the year ended December 31, 2016, primarily due to increases in sales to our partners worldwide. As of December 31, 2017, we sold our products in 45 countries outside of the United States, and we plan to continue to expand our presence in other countries as the opportunities present themselves. Of our international sales revenue in the year ended December 31, 2017, 84.7% was sold in Europe versus 89.4% in the comparative period in 2016. We also acquired MedSupport in the second quarter of 2017, which contributed to increased international sales revenue in 2017.
69
Cost of revenue and gross profit
|
|
|
Years ended December 31, |
|
|
Change 2017 vs. 2016 |
|
|
% of Revenue |
|
|||||||||||||||
|
(amounts in thousands) |
|
2017 |
|
|
2016 |
|
|
$ |
|
|
% |
|
|
2017 |
|
|
2016 |
|
||||||
|
Cost of sales revenue |
|
$ |
110,163 |
|
|
$ |
85,154 |
|
|
$ |
25,009 |
|
|
|
29.4 |
% |
|
|
44.2 |
% |
|
|
42.0 |
% |
|
Cost of rental revenue |
|
|
18,038 |
|
|
|
20,365 |
|
|
|
(2,327 |
) |
|
|
-11.4 |
% |
|
|
7.2 |
% |
|
|
10.0 |
% |
|
Total cost of revenue |
|
$ |
128,201 |
|
|
$ |
105,519 |
|
|
$ |
22,682 |
|
|
|
21.5 |
% |
|
|
51.4 |
% |
|
|
52.0 |
% |
|
|
|
|
|
|
|
|
|
|
|
|
|
|
|
|
|
|
|
|
|
|
|
|
|
|
|
Gross profit - sales revenue |
|
$ |
115,329 |
|
|
$ |
83,016 |
|
|
$ |
32,313 |
|
|
|
38.9 |
% |
|
|
46.2 |
% |
|
|
40.9 |
% |
|
Gross profit - rental revenue |
|
|
5,908 |
|
|
|
14,294 |
|
|
|
(8,386 |
) |
|
|
-58.7 |
% |
|
|
2.4 |
% |
|
|
7.1 |
% |
|
Total gross profit |
|
$ |
121,237 |
|
|
$ |
97,310 |
|
|
$ |
23,927 |
|
|
|
24.6 |
% |
|
|
48.6 |
% |
|
|
48.0 |
% |
|
|
|
|
|
|
|
|
|
|
|
|
|
|
|
|
|
|
|
|
|
|
|
|
|
|
|
Gross margin percentage - sales revenue |
|
|
51.1 |
% |
|
|
49.4 |
% |
|
|
|
|
|
|
|
|
|
|
|
|
|
|
|
|
|
Gross margin percentage- rental revenue |
|
|
24.7 |
% |
|
|
41.2 |
% |
|
|
|
|
|
|
|
|
|
|
|
|
|
|
|
|
|
Total gross margin percentage |
|
|
48.6 |
% |
|
|
48.0 |
% |
|
|
|
|
|
|
|
|
|
|
|
|
|
|
|
|
We manufacture our subassemblies and/or products in our Goleta, California and Richardson, Texas facilities. We also began production of our Inogen One G3 concentrators in the fourth quarter of 2017 using a contract manufacturer, Foxconn, located in the Czech Republic to improve our ability to service our European customers. Our manufacturing process includes final assembly, testing, and packaging to quality and customer specifications. Cost of sales revenue increased $25.0 million for the year ended December 31, 2017 from the year ended December 31, 2016, or an increase of 29.4% over the comparable period. The increase in cost of sales revenue was primarily attributable to an increase in the number of systems sold, partially offset by reduced bill of material costs for our products associated with design changes, better sourcing and price discounts resulting from increased volumes. We expect cost of sales revenue as a percentage of sales revenue in future periods to fluctuate based on customer mix, product mix, and changes in sales prices and cost per unit.
Cost of rental revenue decreased $2.3 million for the year ended December 31, 2017 from the year ended December 31, 2016, or a decrease of 11.4% from the comparable period. The decrease in cost of rental revenue was primarily attributable to a decrease in patients on service and rental asset depreciation expense. Cost of rental revenue included $9.8 million of rental asset depreciation for the year ended December 31, 2017 and $11.4 million for the year ended December 31, 2016.
Gross margin percentage is defined as revenue less costs of revenue divided by revenue. Sales revenue gross margin percentage increased to 51.1% for the year ended December 31, 2017 from 49.4% for the year ended December 31, 2016. The increase in sales gross margin percentage was primarily related to an increase in sales mix toward higher margin domestic direct-to-consumer sales and lower cost per unit, partially offset by a reduction in domestic business-to-business average selling prices as a strategy to increase volumes in this channel. Total worldwide business-to-business sales revenue accounted for 61.6% of total sales revenue in 2017 versus 63.5% in 2016. We expect sales gross margin to fluctuate over time based on changes in the sales channel mix, product mix, and average selling prices and cost per unit.
Rental revenue gross margin percentage decreased to 24.7% for the year ended December 31, 2017 from 41.2% for the year ended December 31, 2016, primarily due to lower net revenue per rental patient resulting from the reimbursement reductions, the $2.0 million benefit from the Cures Act in 2016 and lower billable rental patients on service in 2017, partially offset by lower cost of rental revenue associated primarily with lower depreciation costs.
Research and development expense
|
|
|
Years ended December 31, |
|
|
Change 2017 vs. 2016 |
|
|
% of Revenue |
|
|||||||||||||||
|
(amounts in thousands) |
|
2017 |
|
|
2016 |
|
|
$ |
|
|
% |
|
|
2017 |
|
|
2016 |
|
||||||
|
Research and development expense |
|
$ |
5,313 |
|
|
$ |
5,113 |
|
|
$ |
200 |
|
|
|
3.9 |
% |
|
|
2.1 |
% |
|
|
2.5 |
% |
Research and development expense increased $0.2 million for the year ended December 31, 2017 from the year ended December 31, 2016, or an increase of 3.9% over the prior year. The increase was primarily attributable to a $0.2 million increase in personnel-related expenses and product development expenses for engineering projects.
70
|
|
|
Years ended December 31, |
|
|
Change 2017 vs. 2016 |
|
|
% of Revenue |
|
|||||||||||||||
|
(amounts in thousands) |
|
2017 |
|
|
2016 |
|
|
$ |
|
|
% |
|
|
2017 |
|
|
2016 |
|
||||||
|
Sales and marketing expense |
|
$ |
50,758 |
|
|
$ |
37,540 |
|
|
$ |
13,218 |
|
|
|
35.2 |
% |
|
|
20.3 |
% |
|
|
18.5 |
% |
Sales and marketing expense increased $13.2 million for the year ended December 31, 2017 from the year ended December 31, 2016, or an increase of 35.2% over the comparable year. The increase was primarily attributable to increases of $6.3 million in media spending to supply leads for the increased number of sales force headcount hired, $5.5 million of sales and marketing personnel-related expenses as a result of the increased headcount (which included $3.3 million of wages, benefits and payroll tax expense, $1.7 million of commissions expense and $0.4 million in stock compensation expense), $0.5 million for dues, fees and license costs, $0.4 million in credit card processing fees, $0.3 million of clinical outside services and $0.2 million in other professional fees. These increases were partially offset by a decrease of $0.2 million in giveaways/incentives. In the year ended December 31, 2017, we spent $12.5 million in media and advertising costs versus $6.2 million in the comparative period in 2016.
General and administrative expense
|
|
|
Years ended December 31, |
|
|
Change 2017 vs. 2016 |
|
|
% of Revenue |
|
|||||||||||||||
|
(amounts in thousands) |
|
2017 |
|
|
2016 |
|
|
$ |
|
|
% |
|
|
2017 |
|
|
2016 |
|
||||||
|
General and administrative expense |
|
$ |
37,576 |
|
|
$ |
31,793 |
|
|
$ |
5,783 |
|
|
|
18.2 |
% |
|
|
15.1 |
% |
|
|
15.7 |
% |
General and administrative expense increased $5.8 million for the year ended December 31, 2017 from the year ended December 31, 2016, or an increase of 18.2% over the comparable year. The increase was primarily attributable to $1.5 million of higher patent defense costs, $1.1 million of increased personnel-related expenses (which included $1.5 million of stock compensation expense and $0.2 million of wages, benefits and payroll tax expense, partially offset by a decrease of $0.6 million of bonus expense), $0.7 million of patent litigation settlement expense, $0.4 million of increased amortization expense, $0.4 million for dues, fees, and licensing costs, $0.4 million in audit and tax fees, $0.3 million of bad debt expense, $0.3 million in legal fees, $0.2 million in additional public company costs, and $0.2 million of decreased net proceeds from sale of assets.
Bad debt expense, expressed as a percentage of total revenue, was 1.5% and 1.8% in the years ended December 31, 2017 and 2016, respectively. In 2017, we spent $3.3 million on patent defense costs compared to $1.8 million in 2016. We also incurred $0.4 million in expenses, primarily in legal costs, associated with the MedSupport acquisition in 2017.
Other income (expense), net
|
|
|
Years ended December 31, |
|
|
Change 2017 vs. 2016 |
|
|
% of Revenue |
|
|||||||||||||||
|
(amounts in thousands) |
|
2017 |
|
|
2016 |
|
|
$ |
|
|
% |
|
|
2017 |
|
|
2016 |
|
||||||
|
Interest expense |
|
$ |
— |
|
|
$ |
(6 |
) |
|
$ |
6 |
|
|
|
-100.0 |
% |
|
|
— |
|
|
|
— |
|
|
Interest income |
|
|
765 |
|
|
|
196 |
|
|
|
569 |
|
|
|
290.3 |
% |
|
|
0.3 |
% |
|
|
0.1 |
% |
|
Other income (expense) |
|
|
1,301 |
|
|
|
(329 |
) |
|
|
1,630 |
|
|
|
-495.4 |
% |
|
|
0.5 |
% |
|
|
-0.2 |
% |
|
Total other income (expense), net |
|
$ |
2,066 |
|
|
$ |
(139 |
) |
|
$ |
2,205 |
|
|
|
-1586.3 |
% |
|
|
0.8 |
% |
|
|
-0.1 |
% |
Total other income (expense), net, increased $2.2 million to total other income of $2.1 million for the year ended December 31, 2017 from a total other expense of $0.1 million for the year ended December 31, 2016. The increase was primarily due to the $1.6 million increase in other income related to foreign currency gains arising from increased transactions in Euros at a higher Euro exchange rate to the U.S. dollar as well as the $0.6 million increase in interest income on cash equivalents and marketable securities.
Income tax expense
|
|
|
Years ended December 31, |
|
|
Change 2017 vs. 2016 |
|
|
% of Revenue |
|
|||||||||||||||
|
(amounts in thousands) |
|
2017 |
|
|
2016 |
|
|
$ |
|
|
% |
|
|
2017 |
|
|
2016 |
|
||||||
|
Income tax expense |
|
$ |
8,654 |
|
|
$ |
2,206 |
|
|
$ |
6,448 |
|
|
|
292.3 |
% |
|
|
3.5 |
% |
|
|
1.1 |
% |
|
Effective income tax rate |
|
|
29.2 |
% |
|
|
9.7 |
% |
|
|
|
|
|
|
|
|
|
|
|
|
|
|
|
|
71
Income tax expense increased $6.4 million for the year ended December 31, 2017 from the year ended December 31, 2016, or an increase of 292.3% from the comparative period. The increase was primarily due to the non-cash income tax provision expense of $7.6 million related to the impact of changes in the tax rate associated with the TCJA, primarily on remeasurement of our U.S. noncurrent deferred tax assets, as well as the 30.5% increase in income before provision for income taxes.
Our effective tax rate in 2017 increased compared to 2016, mostly due to the TCJA, partially offset by an increase in the tax rate benefit from stock-based compensation compared to 2016. In 2017, excess tax benefits recognized from stock-based compensation decreased our income tax expense by $9.9 million and our effective tax rate by 33.5%, as compared to the tax rate without such benefits. For comparison, in 2016, excess tax benefits recognized from stock-based compensation decreased our income tax expense by $6.0 million and our effective tax rate by 26.6%, as compared to the tax rate without such benefits.
The accounting for stock-based compensation will increase or decrease our effective tax rate based upon the difference between our stock-based compensation expense and the deductions taken on our U.S. tax return, which depends upon the stock price at the time of employee option exercise or award vesting. We recognize excess tax benefits on a discrete basis and we anticipate our effective tax rate will vary from year-to-year depending on our stock price in each period.
Net income
|
|
|
Years ended December 31, |
|
|
Change 2017 vs. 2016 |
|
|
% of Revenue |
|
|||||||||||||||
|
(amounts in thousands) |
|
2017 |
|
|
2016 |
|
|
$ |
|
|
% |
|
|
2017 |
|
|
2016 |
|
||||||
|
Net income |
|
$ |
21,002 |
|
|
$ |
20,519 |
|
|
$ |
483 |
|
|
|
2.4 |
% |
|
|
8.4 |
% |
|
|
10.1 |
% |
Net income increased $0.5 million for the year ended December 31, 2017 compared to the year ended December 31, 2016. The increase in net income was primarily related to the increase in revenues of 23.0% and improved gross margin, partially offset by the net charge of $7.6 million related to the TCJA.
72
The following tables set forth our unaudited quarterly statements of income data for each of the eight quarters in the period ended December 31, 2017.
|
(amounts in thousands, except share and per share amounts) |
|
|
|
|
|
|
|
|
|
|
|
|
|
|
|
|
|
Quarterly Results 2017 |
|
Q1 March |
|
|
Q2 June |
|
|
Q3 September |
|
|
Q4 December |
|
||||
|
Total revenue |
|
$ |
52,500 |
|
|
$ |
64,121 |
|
|
$ |
69,030 |
|
|
$ |
63,787 |
|
|
Gross profit |
|
|
25,744 |
|
|
|
31,567 |
|
|
|
33,170 |
|
|
|
30,756 |
|
|
Income before provision (benefit) for income taxes |
|
|
5,879 |
|
|
|
9,166 |
|
|
|
8,817 |
|
|
|
5,794 |
|
|
Provision (benefit) for income taxes |
|
|
(53 |
) |
|
|
828 |
|
|
|
1,479 |
|
|
|
6,400 |
|
|
Net income (loss) |
|
|
5,932 |
|
|
|
8,338 |
|
|
|
7,338 |
|
|
|
(606 |
) |
|
Net income (loss) per share attributable to |
|
|
|
|
|
|
|
|
|
|
|
|
|
|
|
|
|
common stockholders: |
|
|
|
|
|
|
|
|
|
|
|
|
|
|
|
|
|
Basic |
|
$ |
0.29 |
|
|
$ |
0.40 |
|
|
$ |
0.35 |
|
|
$ |
(0.03 |
) |
|
Diluted |
|
$ |
0.27 |
|
|
$ |
0.38 |
|
|
$ |
0.33 |
|
|
$ |
(0.03 |
) |
|
Weighted-average number of shares used in |
|
|
|
|
|
|
|
|
|
|
|
|
|
|
|
|
|
calculating net income (loss) per share attributable |
|
|
|
|
|
|
|
|
|
|
|
|
|
|
|
|
|
to common stockholders: |
|
|
|
|
|
|
|
|
|
|
|
|
|
|
|
|
|
Basic common shares |
|
|
20,489,532 |
|
|
|
20,622,320 |
|
|
|
20,753,789 |
|
|
|
20,869,589 |
|
|
Diluted common shares |
|
|
21,579,721 |
|
|
|
21,848,359 |
|
|
|
21,998,660 |
|
|
|
22,167,358 |
|
|
|
|
|
|
|
|
|
|
|
|
|
|
|
|
|
|
|
|
(amounts in thousands, except share and per share amounts) |
|
|
|
|
|
|
|
|
|
|
|
|
|
|
|
|
|
Quarterly Results 2016 |
|
Q1 March |
|
|
Q2 June |
|
|
Q3 September |
|
|
Q4 December |
|
||||
|
Total revenue |
|
$ |
42,989 |
|
|
$ |
54,567 |
|
|
$ |
54,422 |
|
|
$ |
50,851 |
|
|
Gross profit |
|
|
21,279 |
|
|
|
26,215 |
|
|
|
25,128 |
|
|
|
24,688 |
|
|
Income before provision for income taxes |
|
|
3,400 |
|
|
|
8,042 |
|
|
|
5,449 |
|
|
|
5,834 |
|
|
Provision for income taxes |
|
|
879 |
|
|
|
550 |
|
|
|
203 |
|
|
|
574 |
|
|
Net income |
|
|
2,521 |
|
|
|
7,492 |
|
|
|
5,246 |
|
|
|
5,260 |
|
|
Net income per share attributable to |
|
|
|
|
|
|
|
|
|
|
|
|
|
|
|
|
|
common stockholders: |
|
|
|
|
|
|
|
|
|
|
|
|
|
|
|
|
|
Basic |
|
$ |
0.13 |
|
|
$ |
0.38 |
|
|
$ |
0.26 |
|
|
$ |
0.26 |
|
|
Diluted |
|
$ |
0.12 |
|
|
$ |
0.36 |
|
|
$ |
0.25 |
|
|
$ |
0.25 |
|
|
Weighted-average number of shares used in |
|
|
|
|
|
|
|
|
|
|
|
|
|
|
|
|
|
calculating net income per share attributable |
|
|
|
|
|
|
|
|
|
|
|
|
|
|
|
|
|
to common stockholders: |
|
|
|
|
|
|
|
|
|
|
|
|
|
|
|
|
|
Basic common shares |
|
|
19,827,669 |
|
|
|
19,972,395 |
|
|
|
20,157,688 |
|
|
|
20,310,857 |
|
|
Diluted common shares |
|
|
20,840,367 |
|
|
|
20,997,429 |
|
|
|
21,182,587 |
|
|
|
21,362,513 |
|
Liquidity and capital resources
As of December 31, 2018, we had cash and cash equivalents of $196.6 million, which consisted of highly-liquid investments with a maturity of three months or less. In addition, we held marketable securities of $43.7 million in available-for-sale corporate bonds and U.S. Treasury securities, which had maturities greater than three months. Since inception, we have received net proceeds of $91.7 million from the issuance of redeemable convertible preferred stock and convertible preferred stock and $52.5 million ($49.7 million net proceeds) in connection with the sale of common stock in our initial public offering. Since 2013, we have received $45.2 million from proceeds related to stock option exercises and our employee stock purchase plan. For the years ended December 31, 2018, 2017 and 2016, we received $19.5 million, $14.0 million and $8.0 million, respectively, in proceeds related to these stock programs.
Our principal uses of cash for liquidity and capital resources in the year ended December 31, 2018 consisted of net purchases of available-for-sale investments of $12.7 million and our capital expenditures of $13.0 million including additional rental equipment, intangible assets, and other property, plant and equipment. The uses of cash were partially offset by $0.7 million of gross proceeds received from the sale of former rental assets.
73
We believe that our current cash, cash equivalents, marketable securities, and the cash to be generated from expected product sales and rentals will be sufficient to meet our projected operating and investing requirements for at least the next twelve months. However, our liquidity assumptions may prove to be incorrect, and we could utilize our available financial resources sooner than we currently expect. Our future funding requirements will depend on many factors, including market acceptance of our products; the cost of our research and development activities; payments from customers; the cost, timing, and outcome of litigation or disputes relating to intellectual property rights, our products, employee relations, cyber security incidents, or otherwise; the cost and timing of regulatory clearances or approvals; the cost and timing of establishing additional sales, marketing, and distribution capabilities; and the effect of competing technological and market developments. In the future, we may acquire businesses or technologies from third parties, and we may decide to raise additional capital through debt or equity financing to the extent we believe this is necessary to successfully complete these acquisitions. Our future capital requirements will also depend on many additional factors, including those set forth in the section of this Annual Report on Form 10-K entitled “Risk Factors.”
If we require additional funds in the future, we may not be able to obtain such funds on acceptable terms, or at all. In the future, we may also attempt to raise additional capital through the sale of equity securities or through equity-linked or debt financing arrangements. If we raise additional funds by issuing equity or equity-linked securities, the ownership of our existing stockholders will be diluted. If we raise additional financing by the incurrence of indebtedness, we will be subject to increased fixed payment obligations and could also be subject to restrictive covenants, such as limitations on our ability to incur additional debt, and other operating restrictions that could adversely impact our ability to conduct our business. Any future indebtedness we incur may result in terms that could be unfavorable to equity investors. There can be no assurances that we will be able to raise additional capital, which would adversely affect our ability to achieve our business objectives. In addition, if our operating performance during the next twelve months is below our expectations, our liquidity and ability to operate our business could be adversely affected.
The following tables show a summary of our cash flows and working capital for the periods and as of the dates indicated:
|
(amounts in thousands) |
|
Years ended December 31, |
|
|||||||||
|
Summary of consolidated cash flows |
|
2018 |
|
|
2017 |
|
|
2016 |
|
|||
|
Cash provided by operating activities |
|
$ |
59,977 |
|
|
$ |
60,494 |
|
|
$ |
31,034 |
|
|
Cash used in investing activities |
|
|
(24,965 |
) |
|
|
(24,430 |
) |
|
|
(11,927 |
) |
|
Cash provided by financing activities |
|
|
18,296 |
|
|
|
14,004 |
|
|
|
7,714 |
|
|
Effect of exchange rates on cash |
|
|
373 |
|
|
|
34 |
|
|
|
(76 |
) |
|
Net increase in cash and cash equivalents |
|
$ |
53,681 |
|
|
$ |
50,102 |
|
|
$ |
26,745 |
|
|
(amounts in thousands) |
|
December 31, |
|
|||||
|
Working capital |
|
2018 |
|
|
2017 |
|
||
|
Cash and cash equivalents |
|
$ |
196,634 |
|
|
$ |
142,953 |
|
|
Marketable securities |
|
|
43,715 |
|
|
|
30,991 |
|
|
Accounts receivable, net |
|
|
37,041 |
|
|
|
31,444 |
|
|
Inventories, net |
|
|
27,071 |
|
|
|
18,842 |
|
|
Deferred cost of revenue |
|
|
359 |
|
|
|
361 |
|
|
Income tax receivable |
|
|
2,655 |
|
|
|
1,313 |
|
|
Prepaid expenses and other current assets |
|
|
7,108 |
|
|
|
2,584 |
|
|
Total current assets |
|
|
314,583 |
|
|
|
228,488 |
|
|
|
|
|
|
|
|
|
|
|
|
Accounts payable and accrued expenses |
|
|
26,786 |
|
|
|
20,626 |
|
|
Accrued payroll |
|
|
11,407 |
|
|
|
6,877 |
|
|
Warranty reserve-current |
|
|
3,549 |
|
|
|
2,505 |
|
|
Deferred revenue-current |
|
|
4,451 |
|
|
|
3,533 |
|
|
Income tax payable |
|
|
392 |
|
|
|
345 |
|
|
Total current liabilities |
|
|
46,585 |
|
|
|
33,886 |
|
|
|
|
|
|
|
|
|
|
|
|
Net working capital |
|
$ |
267,998 |
|
|
$ |
194,602 |
|
Operating activities
We derive operating cash flows from cash collected from the sales and rental of our products and services. These cash flows received are partially offset by our use of cash for operating expenses to support the growth of our business. Net income in each period has increased associated with increased sales, improving product mix and lower costs of revenues.
74
Net cash provided by operating activities for the year ended December 31, 2018 consisted primarily of our net income of $51.8 million and non-cash expense items such as provision for sales returns and doubtful accounts of $17.5 million, stock-based compensation expense of $12.8 million, depreciation of equipment and leasehold improvements and amortization of our intangibles of $11.3 million, provision for rental revenue adjustments of $2.7 million, and loss on disposal of rental equipment and other fixed assets of $1.2 million. These were partially offset by an increase in deferred tax assets of $11.6 million and gain on sale of former rental assets of $0.4 million. The net changes in operating assets and liabilities resulted in a net use of cash of $25.6 million.
Net cash provided by operating activities for the year ended December 31, 2017 consisted primarily of our net income of $21.0 million and non-cash expense items such as provision for sales returns and doubtful accounts of $13.8 million, depreciation of our equipment and leasehold improvements and amortization of our intangibles of $12.3 million, stock-based compensation expense of $9.6 million, provision for rental revenue adjustments of $5.1 million, deferred income tax of $7.9 million and loss on disposal of rental equipment and other fixed assets of $1.1 million. The net changes in operating assets and liabilities resulted in a net use of cash of $10.6 million.
Net cash provided by operating activities for the year ended December 31, 2016 consisted primarily of our net income of $20.5 million and non-cash expense items such as depreciation and amortization of our equipment and leasehold improvements of $13.6 million, provision for sales returns and doubtful accounts of $11.1 million, provision for rental revenue adjustments of $10.8 million, stock-based compensation expense of $7.3 million, and loss on disposal of rental equipment and other fixed assets of $1.2 million which was partially offset by a gain on sale of former assets of $0.3 million. The net changes in operating assets and liabilities resulted in a net decrease in cash of $34.3 million.
Investing activities
Net cash used in investing activities for each of the periods presented primarily included cash used in the production and purchase of rental assets, manufacturing tooling, and computer equipment and software to support our expanding business as well as net (purchases) maturities of available-for-sale investments.
For the year ended December 31, 2018, we invested $76.2 million in corporate bonds and U.S. Treasury securities with maturities greater than three months that were classified as marketable securities, partially offset by $63.5 million in maturities of available-for-sale investments. In addition, we invested $13.0 million in the production and purchase of rental assets, intangible assets and other property, equipment, and leasehold improvements, partially offset from gross proceeds received from the sale of former rental assets of $0.7 million.
For the year ended December 31, 2017, we had $46.9 million of purchases that we invested in available-for-sale certificates of deposits, corporate bonds, agency mortgage-backed securities, and U.S. treasury securities with maturities greater than three months that were classified as marketable securities, partially offset by $37.0 million in maturities of available-for-sale investments. In addition, we invested $10.2 million in the production and purchase of rental assets, intangibles assets and other property, equipment, leasehold improvements, and acquired MedSupport for a net cash payment of $4.5 million, partially offset by gross proceeds from the sale of former assets of $0.2 million.
For the year ended December 31, 2016, we had $33.1 million of purchases that we invested in available-for-sale certificates of deposits and corporate bonds with maturities greater than three months that were classified as marketable securities, partially offset by $28.8 million in maturities of available-for-sale investments. In addition, we invested $8.0 million in rental assets and other property, equipment, leasehold improvements, and intangible assets partially offset from gross proceeds by the sale of former assets of $0.4 million.
We expect to continue investing in property, equipment and leasehold improvements as we expand our operations. Our business is inherently capital intensive. For example, we expend significant manufacturing and production expense in connection with the development and production of our oxygen concentrator products and, in connection with our rental business, we incur expense in the deployment of rental equipment to our patients. Investments will continue to be required in order to grow our sales revenue and continue to supply and replace rental equipment to our rental patients on service.
Financing activities
Historically, we have funded our operations through our sales and rental revenue, the issuance of preferred and common stock, and the incurrence of indebtedness.
For the year ended December 31, 2018, net cash provided by financing activities consisted of $19.5 million from the proceeds received from stock options that were exercised and purchases under our employee stock purchase program, partially offset by the payment of employment taxes related to the vesting of restricted stock awards and restricted stock units of $1.2 million.
75
For the year ended December 31, 2017, net cash provided by financing activities consisted of $14.0 million from the proceeds received from stock options that were exercised and purchases under our employee stock purchase program.
For the year ended December 31, 2016, net cash provided by financing activities consisted primarily of $8.0 million from the proceeds received from stock options that were exercised and purchases under our employee stock purchase program, partially offset by $0.3 million of payments on our contractual obligation.
Working capital
Working capital at any specific point in time is subject to many variables including seasonality, inventory management, and the timing of cash receipts and payments.
Current assets increased $86.1 million during the year ended December 31, 2018 from December 31, 2017 primarily due to an increase in cash, cash equivalents and marketable securities of $66.4 million driven by strong cash flows from operations as well as increases of $8.2 million in net inventories, $5.6 million in net accounts receivable, $4.5 million in prepaid expenses and other current assets, and $1.3 million in income tax receivable.
Gross accounts receivable increased $4.4 million during the year ended December 31, 2018 from December 31, 2017, primarily due to an increase in gross business-to-business accounts receivable and other receivables balance of $7.2 million primarily as a result of higher sales in the year ended December 31, 2018 versus the year ended December 31, 2017 where total sales revenues were $336.0 million and $225.5 million, respectively, partially offset by a decrease in gross rental accounts receivable balance of $2.8 million. Allowances on accounts receivable decreased $1.2 million during the year ended December 31, 2018 from December 31, 2017, primarily due to a decrease of $0.7 million in the allowance for doubtful accounts and a decrease of $0.5 million in the allowance for rental revenue adjustments from the comparative consolidated balance sheet date.
Allowances on accounts receivable vary based on credit quality, age, and accounts receivable source. Rental revenue has higher allowances on accounts receivable versus sales revenue due to the nature of the collectability of these balances.
Current liabilities increased by $12.7 million during the year ended December 31, 2018 from December 31, 2017, primarily due to an increase in accounts payable and accrued expenses of $6.2 million mainly caused by the timing of payments for higher levels of inventory as well as increases in accrued payroll of $4.5 million, warranty reserve of $1.0 million, and $0.9 million in deferred revenue.
Sources of funds
Our cash provided by operating activities in the year ended December 31, 2018 was $60.0 million compared to $60.5 million in the year ended December 31, 2017. As of December 31, 2018, we had cash and cash equivalents of $196.6 million.
Use of funds
Our principal uses of cash are funding our new rental asset deployments and other capital purchases, operations, and other working capital requirements. Over the past several years, our revenue has increased significantly from year-to-year and, as a result, our cash flows from customer collections have increased as have our profits. As a result, our cash provided by operating activities has increased over time and now is a significant source of capital to the business, which we expect to continue in the future.
We may need to raise additional funds to support our investing operations, and such funding may not be available to us on acceptable terms, or at all. If we are unable to raise additional funds when needed, our operations and ability to execute our business strategy could be adversely affected. We may seek to raise additional funds through equity, equity-linked or debt financings. If we raise additional funds through the incurrence of indebtedness, such indebtedness would have rights that are senior to holders of our equity securities and could contain covenants that restrict our operations. Any additional equity financing may be dilutive to our stockholders.
76
EBITDA, Adjusted EBITDA, and non-GAAP net income are financial measures that are not calculated in accordance with U.S. GAAP. We define EBITDA as net income excluding interest income, interest expense, taxes and depreciation and amortization. Adjusted EBITDA also excludes stock-based compensation. Non-GAAP net income, which we previously referred to as “Adjusted Net Income,” excludes certain tax benefit adjustments. Below, we have provided a reconciliation of EBITDA, Adjusted EBITDA and non-GAAP net income to our net income, the most directly comparable financial measure calculated and presented in accordance with U.S. GAAP. EBITDA, Adjusted EBITDA and non-GAAP net income should not be considered alternatives to net income or any other measure of financial performance calculated and presented in accordance with U.S. GAAP. Our EBITDA, Adjusted EBITDA and non-GAAP net income may not be comparable to similarly titled measures of other organizations because other organizations may not calculate EBITDA, Adjusted EBITDA and non-GAAP net income in the same manner as we calculate these measures.
We include EBITDA, Adjusted EBITDA and non-GAAP net income in this Annual Report on Form 10-K because they are important measures upon which our management assesses our operating performance. We use EBITDA, Adjusted EBITDA and non-GAAP net income as key performance measures because we believe they facilitate operating performance comparisons from period-to-period by excluding potential differences primarily caused by variations in capital structures, tax positions, the impact of depreciation and amortization expense on our fixed assets and the impact of stock-based compensation expense. Because EBITDA, Adjusted EBITDA and non-GAAP net income facilitate internal comparisons of our historical operating performance on a more consistent basis, we also use EBITDA, Adjusted EBITDA and non-GAAP net income for business planning purposes, to incentivize and compensate our management personnel, and in evaluating acquisition opportunities. In addition, we believe EBITDA, Adjusted EBITDA and non-GAAP net income and similar measures are widely used by investors, securities analysts, ratings agencies, and other parties in evaluating companies in our industry as a measure of financial performance and debt-service capabilities.
Our uses of EBITDA, Adjusted EBITDA and non-GAAP net income have limitations as analytical tools, and you should not consider them in isolation or as a substitute for analysis of our results as reported under U.S. GAAP. Some of these limitations are:
|
|
• |
EBITDA and Adjusted EBITDA do not reflect our cash expenditures for capital equipment or other contractual commitments; |
|
|
• |
although depreciation and amortization are non-cash charges, the assets being depreciated and amortized may have to be replaced in the future, and EBITDA and Adjusted EBITDA do not reflect capital expenditure requirements for such replacements; |
|
|
• |
EBITDA and Adjusted EBITDA do not reflect changes in, or cash requirements for, our working capital needs; |
|
|
• |
EBITDA and Adjusted EBITDA do not reflect the interest expense or the cash requirements necessary to service interest or principal payments on our indebtedness; |
|
|
• |
Non-GAAP net income does not reflect the tax benefits adjustments recorded based on U.S. GAAP; and |
|
|
• |
other companies, including companies in our industry, may calculate EBITDA, Adjusted EBITDA and non-GAAP net income measures differently, which reduces their usefulness as a comparative measure. |
In evaluating EBITDA, Adjusted EBITDA and non-GAAP net income, we anticipate that in the future we will incur expenses within these categories similar to this presentation. Our presentation of EBITDA, Adjusted EBITDA and non-GAAP net income should not be construed as an inference that our future results will be unaffected by certain expenses. When evaluating our performance, you should consider EBITDA, Adjusted EBITDA and non-GAAP net income alongside other financial performance measures, including U.S. GAAP results.
The following tables present a reconciliation of EBITDA, Adjusted EBITDA and non-GAAP net income to our net income, the most comparable U.S. GAAP measure, for each of the periods indicated:
|
(amounts in thousands) |
|
Years ended December 31, |
|
|||||||||
|
Non-GAAP EBITDA and Adjusted EBITDA |
|
2018 |
|
|
2017 |
|
|
2016 |
|
|||
|
Net income |
|
$ |
51,845 |
|
|
$ |
21,002 |
|
|
$ |
20,519 |
|
|
Non-GAAP adjustments: |
|
|
|
|
|
|
|
|
|
|
|
|
|
Interest expense |
|
|
— |
|
|
|
— |
|
|
|
6 |
|
|
Interest income |
|
|
(3,259 |
) |
|
|
(765 |
) |
|
|
(196 |
) |
|
Provision (benefit) for income taxes |
|
|
(11,390 |
) |
|
|
8,654 |
|
|
|
2,206 |
|
|
Depreciation and amortization |
|
|
11,295 |
|
|
|
12,302 |
|
|
|
13,558 |
|
|
EBITDA (non-GAAP) |
|
|
48,491 |
|
|
|
41,193 |
|
|
|
36,093 |
|
|
Stock-based compensation |
|
|
12,790 |
|
|
|
9,640 |
|
|
|
7,294 |
|
|
Adjusted EBITDA (non-GAAP) |
|
$ |
61,281 |
|
|
$ |
50,833 |
|
|
$ |
43,387 |
|
77
|
(amounts in thousands) |
|
Years ended December 31, |
|
|||||||||
|
Non-GAAP net income |
|
2018 |
|
|
2017 |
|
|
2016 |
|
|||
|
Net income |
|
$ |
51,845 |
|
|
$ |
21,002 |
|
|
$ |
20,519 |
|
|
Non-GAAP adjustment: |
|
|
|
|
|
|
|
|
|
|
|
|
|
2017 U.S. tax reform (TCJA)(1) |
|
|
— |
|
|
|
7,578 |
|
|
|
— |
|
|
Non-GAAP net income |
|
$ |
51,845 |
|
|
$ |
28,580 |
|
|
$ |
20,519 |
|
|
(1) |
On December 22, 2017, the TCJA was enacted into law, which significantly changed existing U.S. tax law and included numerous provisions that impact our financial results. During the fourth quarter of 2017, we recorded an estimated one-time net charge due to the impact of changes in the tax rate, primarily on deferred tax assets. There were no related charges during the year ended December 31, 2018. |
Contractual obligations
The following table reflects a summary of our contractual obligations as of December 31, 2018.
|
|
|
Payments due by period |
|
|||||||||||||||||
|
Contractual Obligations |
|
|
|
|
|
Less than |
|
|
1-3 |
|
|
3-5 |
|
|
More than |
|
||||
|
(amounts in thousands) |
|
Total |
|
|
1 year |
|
|
years |
|
|
years |
|
|
5 years |
|
|||||
|
Operating leases - properties (1) |
|
$ |
9,471 |
|
|
$ |
2,417 |
|
|
$ |
4,935 |
|
|
$ |
2,119 |
|
|
$ |
— |
|
|
Operating leases - equipment and other (2) |
|
|
230 |
|
|
|
63 |
|
|
|
154 |
|
|
|
13 |
|
|
|
— |
|
|
Purchase obligations (3) |
|
|
61,000 |
|
|
|
61,000 |
|
|
|
— |
|
|
|
— |
|
|
|
— |
|
|
Total |
|
$ |
70,701 |
|
|
$ |
63,480 |
|
|
$ |
5,089 |
|
|
$ |
2,132 |
|
|
$ |
— |
|
|
(1) |
We lease manufacturing and office space in Richardson, TX, Goleta, CA, Smyrna, TN, Huntsville, AL, Aurora, CO, Cleveland, OH and Breukelen, Netherlands with terms that expire between 2019 and 2024. |
|
(2) |
This consists of miscellaneous office and processing equipment in Texas, California and Ohio with terms expiring between 2019 and 2023. |
|
(3) |
We obtain individual components for our products from a wide variety of individual suppliers. Consistent with industry practice, we acquire components through a combination of purchase orders, supplier contracts, and open orders based on projected demand information. Where appropriate, the purchases are applied to inventory component prepayments that are outstanding with the respective suppliers. |
As of December 31, 2018, we had noncurrent deferred tax liabilities of $0.2 million which were netted in noncurrent deferred tax assets on the balance sheet. Additionally, as of December 31, 2018, we had gross unrecognized tax benefits of $1.3 million. The table does not include any payments related to liabilities recorded for uncertain tax positions as we cannot make a reasonably reliable estimate as to the timing of any other payments. See Note 5 to our audited consolidated financial statements included elsewhere in this Annual Report on Form 10-K.
Critical accounting policies and significant estimates
Our discussion and analysis of our financial condition and results of operations are based upon our consolidated financial statements which have been prepared in accordance with generally accepted accounting principles in the United States of America, or U.S. GAAP. The preparation of these financial statements requires us to make estimates and judgments that affect the reported amounts of assets and liabilities and related disclosure of contingent assets and liabilities, revenue and expenses at the date of the financial statements. Generally, we base our estimates on historical experience and on various other assumptions in accordance with U.S. GAAP that we believe to be reasonable under the circumstances. Actual results may differ from these estimates and such differences could be material to the financial position and results of operations.
Critical accounting policies and estimates are those that we consider the most important to the portrayal of our financial condition and results of operations because they require our most difficult, subjective or complex judgments, often as a result of the need to make estimates about the effect of matters that are inherently uncertain. Our critical accounting policies and estimates include those related to:
|
|
• |
revenue recognition; |
|
|
• |
inventory and rental assets; and |
|
|
• |
income taxes. |
78
We generate revenue primarily from sales and rentals of our products. Our products consist of our proprietary line of oxygen concentrators and related accessories. Other revenue primarily comes from service contracts, replacement parts and freight revenue for product shipments.
Revenue is recognized upon transfer of control of promised products or services to customers in an amount that reflects the consideration we expect to receive in exchange for those products or services. Revenue from product sales is generally recognized upon shipment of the product but is deferred for certain transactions when control has not yet transferred to the customer.
Our product is generally sold with a right of return and we may provide other incentives, which are accounted for as variable consideration when estimating the amount of revenue to recognize. Returns and incentives are estimated at the time sales revenue is recognized. The provisions for estimated returns are made based on known claims and estimates of additional returns based on historical data and future expectations. Sales revenue incentives within our contracts are estimated based on the most likely amounts expected on the related sales transaction and recorded as a reduction to revenue at the time of sale in accordance with the terms of the contract. Accordingly, revenue is recognized net of allowances for estimated returns and incentives.
We also offer a lifetime warranty for direct-to-consumer sales of our portable oxygen concentrators. For a fixed price, we agree to provide a fully functional portable oxygen concentrator for the remaining life of the patient. Lifetime warranties are only offered to patients upon the initial sale of portable oxygen concentrators directly from us and are non-transferable. Lifetime warranties are considered to be a distinct performance obligation that are accounted for separately from its sale of portable oxygen concentrators with a standard warranty of three years.
The revenue is allocated to the distinct lifetime warranty performance obligation based on a relative SSP method. We have vendor-specific objective evidence of the selling price for our equipment. To determine the selling price of the lifetime warranty, we use the best estimate of the SSP for the distinct performance obligation as the lifetime warranty is neither separately priced nor is the selling price available through third-party evidence. To calculate the selling price associated with the lifetime warranties, management considers the profit margins of service revenue, the average estimated cost of lifetime warranties and the price of extended warranties. Revenue from the distinct lifetime warranty is deferred after the delivery of the equipment and recognized based on an estimated mortality rate over five years, which is the estimated performance period of the contract based on the average patient life expectancy.
Revenue from the sale of our repair services is recognized when the performance obligations are satisfied, and collection of the receivables is probable. Other revenue from the sale of replacement parts is generally recognized when product is shipped to customers.
Freight revenue consists of fees associated with the deployment of products internationally and domestically when expedited freight options are requested or when minimum order quantities are not met. Freight revenue is generally recognized upon shipment of the product but is deferred if control has not yet transferred to the customer. Shipping and handling costs for sold products and rental assets shipped to our customers are included on the consolidated statement of comprehensive income as part of cost of sales revenue and cost of rental revenue, respectively.
The payment terms and conditions of customer contracts vary by customer type and the products and services offered. For certain products or services and customer types, we require payment before the products or services are delivered to the customer. The timing of sales revenue recognition, billing and cash collection results in billed accounts receivable and deferred revenue in the consolidated balance sheet.
Contract liabilities primarily consist of deferred revenue related to lifetime warranties on direct-to-consumer sales revenue when cash payments are received in advance of services performed under the contract. The contract with the customer states the final terms of the sale, including the description, quantity, and price of each product or service purchase. The increase in deferred revenue related to lifetime warranties for the year ended December 31, 2018 was primarily driven by $6.9 million of payments received in advance of satisfying the distinct performance obligations, partially offset by $2.9 million of revenue recognized that were included in the deferred revenue balance as of December 31, 2017. The increase in deferred revenue related to lifetime warranties for the year ended December 31, 2017 was primarily driven by $4.3 million of payments received in advance of satisfying the distinct performance obligations, partially offset by $0.8 million of revenue recognized that were included in the deferred revenue balance as of December 31, 2016. Deferred revenue related to lifetime warranties was $14.9 million and $10.8 million as of December 31, 2018 and December 31, 2017, respectively, and is classified within deferred revenue – current and noncurrent deferred revenue in the consolidated balance sheet.
79
We elected to apply the practical expedient in accordance with ASC 606—Revenue Recognition and did not evaluate contracts of one year or less for the existence of a significant financing component. We do not expect any revenue to be recognized over a multi-year period with the exception of revenue related to lifetime warranties.
We recognize equipment rental revenue over the non-cancelable lease term, which is one month, less estimated adjustments, per ASC 840—Leases. We have separate contracts with each patient that are not subject to a master lease agreement with any payor. We evaluate the individual lease contracts at lease inception and the start of each monthly renewal period to determine if there is reasonable assurance that the bargain renewal option associated with the potential capped free rental period would be exercised. Historically, the exercise of such bargain renewal option is not reasonably assured at lease inception and most subsequent monthly lease renewal periods. If we determine that the reasonable assurance threshold for an individual patient is met at lease inception or at a monthly lease renewal period, such determination would impact the bargain renewal period for an individual lease. We would first consider the lease classification (sales-type lease or operating lease) and then appropriately recognize or defer rental revenue over the lease term, which may include a portion of the capped rental period. To date, we have not deferred any amounts associated with the capped rental period. Amounts related to the capped rental period have not been material in the periods presented.
The lease term begins on the date products are shipped to patients and are recorded at amounts estimated to be received under reimbursement arrangements with third-party payors, including Medicare, private payors, and Medicaid. Due to the nature of the industry and the reimbursement environment in which we operate, certain estimates are required to record net revenue and accounts receivable at their net realizable values. Inherent in these estimates is the risk that they will have to be revised or updated as additional information becomes available. Specifically, the complexity of many third-party billing arrangements and the uncertainty of reimbursement amounts for certain services from certain payors may result in adjustments to amounts originally recorded. Such adjustments are typically identified and recorded at the point of cash application, claim denial or account review. Accounts receivable are reduced by an allowance for doubtful accounts which provides for those accounts from which payment is not expected to be received, although product was delivered and revenue was earned. Upon determination that an account is uncollectable, it is written-off and charged to the allowance. Amounts billed but not earned due to the timing of the billing cycle are deferred and recognized in revenue on a straight-line basis over the monthly billing period. For example, if the first day of the billing period does not fall on the first of the month, then a portion of the monthly billing period will fall in the subsequent month and the related revenue and cost would be deferred based on the service days in the following month.
Rental revenue is recognized as earned, less estimated adjustments. Revenue not billed at the end of the period is reviewed for the likelihood of collections and accrued. The rental revenue stream is not guaranteed and payment will cease if the patient no longer needs oxygen or returns the equipment. Revenue recognized is at full estimated allowable reimbursement rates. Rental revenue is earned for that month if the patient is on service on the first day of the 30-day period commencing on the recurring date of service for a particular claim, regardless if there is a change in condition/death after that date. In the event that a third-party payor does not accept the claim for payment, the consumer is ultimately responsible for payment for the products and services. We have determined that the balances are collectable at the time of revenue recognition because the patient signs a notice of financial responsibility outlining their obligations.
Included in rental revenue are unbilled amounts that were earned but not able to be billed for various reasons. The criteria for recognizing revenue had been met as of period-end, but there were specific reasons why we were unable to bill Medicare and private insurance for these amounts. As a result, we create an unbilled rental revenue accrual based on these earned revenues not billed based on a percentage of unbilled amounts and historical trends and estimates of future collectability.
Inventory and rental assets
Inventory consists of raw materials, certain component parts to be used in manufacturing our products and finished goods. Inventory is stated at the lower of cost and net realizable value. Cost is determined using a standard cost method, including material, labor, and manufacturing overhead, whereby the standard costs are updated at least quarterly to reflect approximate actual costs using the first-in, first-out (FIFO) method. We record adjustments at least quarterly to inventory for potentially excess, obsolete, slow-moving or impaired items. The business environment in which we operate is subject to changes in technology and customer demand. Noncurrent inventories are primarily related to raw materials purchased in bulk to support long-term expected repairs to reduce costs and are classified in other assets.
Rental assets are valued at standard cost to manufacture or purchase the product, including appropriate labor and overhead. Costs are reviewed at least quarterly to confirm standard costs approximate actual costs using the FIFO method. Rental assets are depreciated over the useful life of the asset, typically 18 months to 60 months. Rental asset losses are recorded at net book value in cost of rental revenue.
80
We account for income taxes in accordance with ASC 740—Income Taxes. Under ASC 740, income taxes are recognized for the amount of taxes payable or refundable for the current period and deferred tax liabilities and assets are recognized for the future tax consequences of transactions that have been recognized in our consolidated financial statements or tax returns. A valuation allowance is provided when it is more likely than not that some portion, or all, of the deferred tax asset will not be realized.
We account for uncertainties in income tax in accordance with ASC 740-10—Accounting for Uncertainty in Income Taxes. ASC 740-10 prescribes a recognition threshold and measurement attribute for the financial statement recognition and measurement of a tax position taken or expected to be taken in a tax return. This accounting standard also provides guidance on derecognition, classification, interest and penalties, accounting in interim periods, disclosure and transition.
We recognize interest and penalties on income taxes, if any, within income tax provision. No significant interest or penalties were recognized during the periods presented.
On December 22, 2017, the TCJA was enacted into law, which significantly changes existing U.S. tax law and includes numerous provisions that affect our business. Changes include, but are not limited to, a corporate tax rate decrease from 34% to 21% effective for tax years beginning after December 31, 2017, expensing of capital expenditures, the transition of U.S. international taxation from a worldwide tax system to a territorial system, a one-time transition tax on the mandatory deemed repatriation of cumulative foreign earnings, and limitations on the deductibility of certain executive compensation and other deductions. We are required to recognize the effect of the tax law changes in the period of enactment, including the transition tax, re-measuring our U.S. deferred tax assets and liabilities, as well as reassessing the net realizability of our deferred tax assets and liabilities. During the fourth quarter of 2017, we recorded a provisional net charge of $7.6 million related to the TCJA due to the remeasurement of the deferred taxes. There was no impact related to the one-time transition tax on the mandatory deemed repatriation of foreign earnings.
As of December 31, 2018, we completed our evaluation and analysis of the TCJA and there was no additional adjustment to the provisional amount recorded in the fourth quarter of 2017. For the foreign derived intangible income, executive compensation, and other deductions, there was no estimate recorded for the year ended December 31, 2018. We established a policy election to use the period cost method to record deferred taxes for basis differences expected to reverse as a result of the global intangible low tax income provisions.
We have operations in multiple U.S. states and the Netherlands. The statute of limitations has expired for all tax years prior to 2015 for federal jurisdictions and 2014 to 2015 for various state tax jurisdictions. However, the net operating loss generated on our federal and state tax returns in prior years may be subject to adjustments by the federal and state tax authorities.
We determined the income tax provision for interim periods using an estimate of our annual effective tax rate, adjusted for discrete items arising in that quarter. In each quarter, we update our estimated annual effective tax rate, and if the estimated annual effective tax rate changes, a cumulative adjustment is recorded in that quarter. Our quarterly income tax provision and quarterly estimate of the annual effective tax rate are subject to volatility due to several factors, including our ability to accurately predict the proportion of our income (loss) before provision for income taxes in multiple jurisdictions, the tax effects of our stock-based compensation, and the effects of our acquisition and the integration of that acquisition.
Recent accounting pronouncements
Refer to Note 1 – Summary of significant accounting policies of the Notes included in Part II, Item 8, "Financial Statements and Supplementary Data" in this Annual Report on Form 10-K for further discussion.
Off-balance sheet arrangements
We do not have any relationships with unconsolidated entities or financial partnerships, such as entities often referred to as structured finance or special purpose entities, which would have been established for the purpose of facilitating off-balance sheet arrangements or for any other contractually narrow or limited purpose. However, from time-to-time, we enter into certain types of contracts that contingently require us to indemnify parties against third-party claims including certain real estate leases, supply purchase agreements, and directors and officers. The terms of such obligations vary by contract and in most instances a maximum dollar amount is not explicitly stated therein. Generally, amounts under these contracts cannot be reasonably estimated until a specific claim is asserted thus no liabilities have been recorded for these obligations on our balance sheets for any of the periods presented.
81
We do not believe that inflation has had a material effect on our business, financial condition or results of operations. If our costs were to become subject to significant inflationary pressures, we might not be able to fully offset such higher costs through price increases. Our inability or failure to do so could harm our business, financial condition and results of operations.
ITEM 7A. QUANTITATIVE AND QUALITATIVE DISCLOSURES ABOUT MARKET RISK
We are exposed to various market risks, including fluctuation in interest rates, foreign currency, and exchange rates. Market risk is the potential loss arising from adverse changes in market rates and prices. We do not hold or issue financial instruments for trading purposes.
Interest rate fluctuation risk
The principal market risk we face is interest rate risk. We had cash and cash equivalents of $196.6 million as of December 31, 2018, which consisted of highly-liquid investments with a maturity of three months or less, and $43.7 million of marketable securities with maturity dates of greater than three months. The primary goals of our investment policy are liquidity and capital preservation. We do not enter into investments for trading or speculative purposes. We believe that we do not have any material exposure to changes in the fair value of these assets as a result of changes in interest rates due to the short-term nature of our cash and cash equivalents. Declines in interest rates, however, would reduce future investment income. We considered the historical volatility of short-term interest rates and determined that it was reasonably possible that an adverse change of 100 basis points could be experienced in the near term. A hypothetical 1.00% (100 basis points) increase in interest rates would not have materially impacted the fair value of our marketable securities as of December 31, 2018 and December 31, 2017. If overall interest rates had decreased by 1.00% (100 basis points), our interest income would not have been materially affected during the years ended December 31, 2018 or December 31, 2017.
As of December 31, 2018, we had no credit facility in place. If overall interest rates had increased by 1.00% (100 basis points) during the periods presented, our interest expense would not have been affected.
Foreign currency exchange risk
The majority of our revenue is denominated in U.S. dollars while the majority of our European sales are denominated in Euros. In addition, we acquired MedSupport with net assets denominated in Euros in the second quarter of 2017. Our results of operations, certain balance sheet balances and cash flows are, therefore, subject to fluctuations due to changes in foreign currency exchange rates. The volatility of exchange rates depends on many factors that we cannot forecast with reliable accuracy. We have experienced and will continue to experience fluctuations in our net income or loss as a result of transaction gains or losses related to revaluing certain current asset and current liability balances that are denominated in currencies other than the functional currency in which they are recorded. The effect of a 10% adverse change in exchange rates on foreign denominated cash, receivables and payables as of December 31, 2018 would not have had a material effect on our financial position, results of operations or cash flows. As our operations in countries outside of the United States grow, our results of operations and cash flows will be subject to fluctuations due to changes in foreign currency exchange rates, which could harm our business in the future.
We began entering into foreign exchange forward contracts to protect our forecasted U.S. dollar-equivalent earnings from adverse changes in foreign currency exchange rates in December 2015. These hedging contracts reduce, but will not entirely eliminate, the impact of adverse currency exchange rate movements on revenue. We performed a sensitivity analysis assuming a hypothetical 10% adverse movement in foreign exchange rates to the hedging contracts and the underlying exposures described above. As of December 31, 2018, the analysis indicated that these hypothetical market movements would not have a material effect on our financial position, results of operations or cash flows. We estimate prior to any hedging activity that a 10% adverse change in exchange rates on our foreign denominated sales would have resulted in a $5.5 million decline in revenue for the year ended December 31, 2018. We designate these forward contracts as cash flow hedges for accounting purposes. The fair value of the forward contract is separated into intrinsic and time values. The fair value of forward currency-exchange contracts is sensitive to changes in currency exchange rates. Changes in the time value are coded in other income (expense), net. Changes in the intrinsic value are recorded as a component of accumulated other comprehensive income and subsequently reclassified into revenue to offset the hedged exposures as they occur.
ITEM 8. FINANCIAL STATEMENTS AND SUPPLEMENTARY DATA
The financial statements and supplementary data required by this item are included in Part IV, Item 15 of this Report.
82
ITEM 9. CHANGES IN AND DISAGREEMENTS WITH ACCOUNTANTS ON ACCOUNTING AND FINANCIAL DISCLOSURE
None.
ITEM 9A. CONTROLS AND PROCEDURES
Evaluation of disclosure controls and procedures
The Company maintains a system of disclosure controls and procedures as defined in Rules 13a-15(e) and 15d-15(e) under the Securities Exchange Act of 1934, as amended (the “Exchange Act”), which are designed to provide reasonable assurance that information required to be disclosed in the reports that the Company files or submits under the Exchange Act, is recorded, processed, summarized and reported accurately and completely within the time periods specified in the SEC’s rules and forms. These disclosure controls and procedures include, among other processes, controls and procedures designed to ensure that information required to be disclosed in the reports that the Company files or submits under the Exchange Act is accumulated and communicated to management, including the Chief Executive Officer and Chief Financial Officer, as appropriate, to allow timely decisions regarding required disclosure. Due to inherent limitations, internal control over financial reporting may not prevent or detect misstatements. Further, projections of any evaluation of effectiveness to future periods are subject to the risk that controls may become inadequate because of changes in conditions over time, or that the degree of compliance with the policies and procedures may deteriorate. Accordingly, even effective disclosure controls and procedures can only provide reasonable assurance of achieving their control objectives. Our management, with the participation of our Chief Executive Officer and our Chief Financial Officer, evaluated the effectiveness of our disclosure controls and procedures as of December 31, 2018. Based upon the evaluation described above, our Chief Executive Officer and Chief Financial Officer concluded that, as of December 31, 2018, our disclosure controls and procedures were effective at the reasonable assurance level.
Management’s report on internal control over financial reporting
Our management is responsible for establishing and maintaining adequate internal control over financial reporting (as defined in Rules 13a-15(f) and 15d-15(f) under the Exchange Act). Our management, including our Chief Executive Officer and Chief Financial Officer, conducted an assessment of the effectiveness of our internal control over financial reporting based on the criteria set forth in Internal Control—Integrated Framework issued by the Committee of Sponsoring Organizations of the Treadway Commission (2013 framework) (COSO). Based on our evaluation under the COSO framework, our management concluded that our internal control over financial reporting was effective as of December 31, 2018 to provide reasonable assurance regarding the reliability of financial reporting and the preparation of financial statements in accordance with U.S. GAAP.
The effectiveness of our internal control over financial reporting as of December 31, 2018 has been audited by our independent registered public accounting firm, Deloitte & Touche LLP, as stated in their report, which appears herein.
83
Report of independent registered public accounting firm
To the stockholders and the Board of Directors of Inogen, Inc.
Opinion on Internal Control over Financial Reporting
We have audited the internal control over financial reporting of Inogen, Inc. and subsidiaries (the “Company”) as of December 31, 2018, based on criteria established in Internal Control — Integrated Framework (2013) issued by the Committee of Sponsoring Organizations of the Treadway Commission (COSO). In our opinion, the Company maintained, in all material respects, effective internal control over financial reporting as of December 31, 2018, based on criteria established in Internal Control — Integrated Framework (2013) issued by COSO.
We have also audited, in accordance with the standards of the Public Company Accounting Oversight Board (United States) (PCAOB), the consolidated financial statements as of and for the year ended December 31, 2018 of the Company and our report dated February 26, 2019, expressed an unqualified opinion on those consolidated financial statements.
Basis for Opinion
The Company’s management is responsible for maintaining effective internal control over financial reporting and for its assessment of the effectiveness of internal control over financial reporting, included in the accompanying Management’s Report on Internal Control over Financial Reporting. Our responsibility is to express an opinion on the Company’s internal control over financial reporting based on our audit. We are a public accounting firm registered with the PCAOB and are required to be independent with respect to the Company in accordance with the U.S. federal securities laws and the applicable rules and regulations of the Securities and Exchange Commission and the PCAOB.
We conducted our audit in accordance with the standards of the PCAOB. Those standards require that we plan and perform the audit to obtain reasonable assurance about whether effective internal control over financial reporting was maintained in all material respects. Our audit included obtaining an understanding of internal control over financial reporting, assessing the risk that a material weakness exists, testing and evaluating the design and operating effectiveness of internal control based on the assessed risk, and performing such other procedures as we considered necessary in the circumstances. We believe that our audit provides a reasonable basis for our opinion.
Definition and Limitations of Internal Control over Financial Reporting
A company’s internal control over financial reporting is a process designed to provide reasonable assurance regarding the reliability of financial reporting and the preparation of financial statements for external purposes in accordance with generally accepted accounting principles. A company’s internal control over financial reporting includes those policies and procedures that (1) pertain to the maintenance of records that, in reasonable detail, accurately and fairly reflect the transactions and dispositions of the assets of the company; (2) provide reasonable assurance that transactions are recorded as necessary to permit preparation of financial statements in accordance with generally accepted accounting principles, and that receipts and expenditures of the company are being made only in accordance with authorizations of management and directors of the company; and (3) provide reasonable assurance regarding prevention or timely detection of unauthorized acquisition, use, or disposition of the company’s assets that could have a material effect on the financial statements.
Because of its inherent limitations, internal control over financial reporting may not prevent or detect misstatements. Also, projections of any evaluation of effectiveness to future periods are subject to the risk that controls may become inadequate because of changes in conditions, or that the degree of compliance with the policies or procedures may deteriorate.
/s/ DELOITTE & TOUCHE LLP
Los Angeles, California
February 26, 2019
84
Changes in internal controls over financial reporting
There has been no change to our internal control over financial reporting identified in connection with the evaluation required by paragraph (d) of Rule 13a-15 or 15d-15 that occurred during our most recent fiscal quarter that has materially affected, or is reasonably likely to materially affect, our internal control over financial reporting.
Limitations on effectiveness of controls
In designing and evaluating the disclosure controls and procedures, management recognizes that any controls and procedures, no matter how well designed and operated, can provide only reasonable assurance of achieving the desired control objectives. In addition, the design of disclosure controls and procedures must reflect the fact that there are resource constraints and that management is required to apply its judgment in evaluating the benefits of possible controls and procedures relative to their costs. Because of the inherent limitations in all control systems, no evaluation of controls can provide absolute assurance that all control issues and instances of fraud, if any, have been detected. Because of the inherent limitations in any control system, misstatements due to error or fraud may occur and not be detected.
Annual Meeting
Our annual meeting of stockholders will be held at 10:00 a.m. Pacific Time on Thursday, May 9, 2019, at our corporate headquarters located at 326 Bollay Drive, Goleta, California 93117. Holders of record at the close of business on Friday, March 15, 2019 will be entitled to vote at the meeting.
Compensatory Arrangements of Certain Officers
On February 22, 2019, the Compensation, Nominating and Governance Committee of our board of directors approved annual base salaries for fiscal 2019 for our principal executive officer, principal finance officer, and certain named executive officers, each as more fully set forth below:
|
|
|
|
|
Annual Base Salary |
|
|
Annual Base Salary |
|
||
|
Name |
|
Position |
|
(Fiscal 2018) |
|
|
(Fiscal 2019) |
|
||
|
Scott Wilkinson (1) |
|
Chief Executive Officer and President |
|
$ |
499,000 |
|
|
$ |
525,000 |
|
|
Alison Bauerlein (2) |
|
Executive Vice President, Finance, |
|
$ |
355,000 |
|
|
$ |
367,000 |
|
|
|
|
Chief Financial Officer, Corporate Secretary |
|
|
|
|
|
|
|
|
|
|
|
and Corporate Treasurer |
|
|
|
|
|
|
|
|
|
Brenton Taylor (3) |
|
Executive Vice President, Engineering |
|
$ |
310,000 |
|
|
$ |
322,000 |
|
|
(1) |
Base salary increase is effective April 1, 2019. The Compensation, Nominating and Governance Committee approved an additional base salary increase to $551,000 effective September 30, 2019. |
|
(2) |
Base salary increase is effective April 1, 2019. |
|
(3) |
Base salary increase is effective April 1, 2019. |
2014 Equity Incentive Plan and 2014 Employee Stock Purchase Plan “Evergreen” Determination
For 2019, our board of directors exercised its authority to not increase the shares available for issuance pursuant to the “evergreen” provisions under our 2014 Equity Incentive Plan and our 2014 Employee Stock Purchase Plan in 2019. Refer to Note 6 – Stockholders’ Equity of the Notes included in Part II, Item 8, “Financial Statements and Supplementary Data” in this Annual Report on Form 10-K for further discussion of the annual share increase provisions of our 2014 Equity Incentive Plan and our 2014 Employee Stock Purchase Plan.
85
ITEM 10. DIRECTORS, EXECUTIVE OFFICERS AND CORPORATE GOVERNANCE
The information called for by this item will be set forth in our Proxy Statement for the Annual Meeting of Stockholders to be filed with the SEC within 120 days of the fiscal year ended December 31, 2018 (the “Proxy Statement”) and is incorporated herein by reference.
Our board of directors has adopted a Code of Ethics and Conduct that applies to all of our employees, officers and directors, including our Chief Executive Officer, Chief Financial Officer and other executive and senior financial officers. The full text of our Code of Ethics and Conduct is posted on the investor relations page on our website which is located at http://investor.inogen.com. We will post any amendments to our code of business conduct and ethics, or waivers of its requirements, on our website.
ITEM 11. EXECUTIVE COMPENSATION
The information required by this item will be disclosed in the Proxy Statement and is incorporated herein by reference.
ITEM 12. SECURITY OWNERSHIP OF CERTAIN BENEFICIAL OWNERS AND MANAGEMENT AND RELATED STOCKHOLDERS MATTERS
The information required by this item will be disclosed in the Proxy Statement and is incorporated herein by reference.
ITEM 13. CERTAIN RELATIONSHIPS AND RELATED TRANSACTIONS, AND DIRECTOR INDEPENDENCE
The information required by this item will be disclosed in the Proxy Statement and is incorporated herein by reference.
ITEM 14. PRINCIPAL ACCOUNTING FEES AND SERVICES
The information required by this item will be disclosed in the Proxy Statement and is incorporated herein by reference.
86
ITEM 15. EXHIBITS, FINANCIAL STATEMENT SCHEDULES
|
(a) |
The following documents are filed as part of this Annual Report on Form 10-K: |
|
|
1. |
Financial Statements |
The consolidated financial statements listed in the accompanying index (page F-1) to the consolidated financial statements are filed as part of this Annual Report on Form 10-K.
|
|
2. |
Financial Statement Schedules |
See Schedule II – Valuation and Qualifying Accounts and Reserves included herein.
All other schedules have been omitted because the information either has been shown in the financial statements or notes thereto or is not applicable or required under this section.
|
(b) |
Exhibits |
Exhibits are filed as part of this Annual Report on Form 10-K and are hereby incorporated by reference. Refer to Exhibit Index included herein.
87
Index to Financial Statements
and Financial Statement Schedule
F-1
Report of independent registered public accounting firm
To the stockholders and the Board of Directors of Inogen, Inc.
Opinion on the Financial Statements
We have audited the accompanying consolidated balance sheets of Inogen, Inc. and subsidiaries (the "Company") as of December 31, 2018 and 2017, and the related consolidated statements of comprehensive income, stockholders' equity, and cash flows for each of the three years in the period ended December 31, 2018, and the related notes and the schedule listed in the Index at Item 15 (collectively referred to as the "financial statements"). In our opinion, the financial statements present fairly, in all material respects, the financial position of the Company as of December 31, 2018 and 2017, and the results of its operations and its cash flows for each of the three years in the period ended December 31, 2018, in conformity with accounting principles generally accepted in the United States of America.
We have also audited, in accordance with the standards of the Public Company Accounting Oversight Board (United States) (PCAOB), the Company's internal control over financial reporting as of December 31, 2018, based on criteria established in Internal Control — Integrated Framework (2013) issued by the Committee of Sponsoring Organizations of the Treadway Commission and our report dated February 26, 2019, expressed an unqualified opinion on the Company's internal control over financial reporting.
Basis for Opinion
These financial statements are the responsibility of the Company's management. Our responsibility is to express an opinion on the Company's financial statements based on our audits. We are a public accounting firm registered with the PCAOB and are required to be independent with respect to the Company in accordance with the U.S. federal securities laws and the applicable rules and regulations of the Securities and Exchange Commission and the PCAOB.
We conducted our audits in accordance with the standards of the PCAOB. Those standards require that we plan and perform the audit to obtain reasonable assurance about whether the financial statements are free of material misstatement, whether due to error or fraud. Our audits included performing procedures to assess the risks of material misstatement of the financial statements, whether due to error or fraud, and performing procedures that respond to those risks. Such procedures included examining, on a test basis, evidence regarding the amounts and disclosures in the financial statements. Our audits also included evaluating the accounting principles used and significant estimates made by management, as well as evaluating the overall presentation of the financial statements. We believe that our audits provide a reasonable basis for our opinion.
/s/ DELOITTE & TOUCHE LLP
Los Angeles, California
February 26, 2019
We have served as the Company’s auditor since 2015.
F-2
(amounts in thousands)
|
|
December 31, |
|
|||||
|
|
2018 |
|
|
2017 |
|
||
|
Assets |
|
|
|
|
|
|
|
|
Current assets |
|
|
|
|
|
|
|
|
Cash and cash equivalents |
$ |
196,634 |
|
|
$ |
142,953 |
|
|
Marketable securities |
|
43,715 |
|
|
|
30,991 |
|
|
Accounts receivable, net |
|
37,041 |
|
|
|
31,444 |
|
|
Inventories, net |
|
27,071 |
|
|
|
18,842 |
|
|
Deferred cost of revenue |
|
359 |
|
|
|
361 |
|
|
Income tax receivable |
|
2,655 |
|
|
|
1,313 |
|
|
Prepaid expenses and other current assets |
|
7,108 |
|
|
|
2,584 |
|
|
Total current assets |
|
314,583 |
|
|
|
228,488 |
|
|
Property and equipment |
|
|
|
|
|
|
|
|
Rental equipment, net |
|
43,038 |
|
|
|
49,349 |
|
|
Manufacturing equipment and tooling |
|
7,338 |
|
|
|
6,858 |
|
|
Computer equipment and software |
|
6,153 |
|
|
|
5,484 |
|
|
Furniture and equipment |
|
1,445 |
|
|
|
746 |
|
|
Leasehold improvements |
|
3,407 |
|
|
|
1,598 |
|
|
Land and building |
|
125 |
|
|
|
125 |
|
|
Construction in process |
|
3,128 |
|
|
|
408 |
|
|
Total property and equipment |
|
64,634 |
|
|
|
64,568 |
|
|
Less accumulated depreciation |
|
(42,293 |
) |
|
|
(44,465 |
) |
|
Property and equipment, net |
|
22,341 |
|
|
|
20,103 |
|
|
Goodwill |
|
2,257 |
|
|
|
2,363 |
|
|
Intangible assets, net |
|
3,755 |
|
|
|
4,717 |
|
|
Deferred tax asset - noncurrent |
|
30,130 |
|
|
|
18,636 |
|
|
Other assets |
|
2,832 |
|
|
|
765 |
|
|
Total assets |
$ |
375,898 |
|
|
$ |
275,072 |
|
See accompanying notes to the consolidated financial statements.
F-3
Consolidated Balance Sheets (continued)
(amounts in thousands, except share and per share amounts)
|
|
December 31, |
|
|||||
|
|
2018 |
|
|
2017 |
|
||
|
Liabilities and stockholders' equity |
|
|
|
|
|
|
|
|
Current liabilities |
|
|
|
|
|
|
|
|
Accounts payable and accrued expenses |
$ |
26,786 |
|
|
$ |
20,626 |
|
|
Accrued payroll |
|
11,407 |
|
|
|
6,877 |
|
|
Warranty reserve - current |
|
3,549 |
|
|
|
2,505 |
|
|
Deferred revenue - current |
|
4,451 |
|
|
|
3,533 |
|
|
Income tax payable |
|
392 |
|
|
|
345 |
|
|
Total current liabilities |
|
46,585 |
|
|
|
33,886 |
|
|
Long-term liabilities |
|
|
|
|
|
|
|
|
Warranty reserve - noncurrent |
|
5,981 |
|
|
|
3,666 |
|
|
Deferred revenue - noncurrent |
|
11,844 |
|
|
|
9,402 |
|
|
Deferred tax liability - noncurrent |
|
232 |
|
|
|
348 |
|
|
Other noncurrent liabilities |
|
832 |
|
|
|
729 |
|
|
Total liabilities |
|
65,474 |
|
|
|
48,031 |
|
|
Commitments and contingencies (Note 7) |
|
|
|
|
|
|
|
|
Stockholders' equity |
|
|
|
|
|
|
|
|
Common stock, $0.001 par value per share; 200,000,000 shares authorized; 21,778,632 and 20,976,350 shares issued and outstanding as of December 31, 2018 and 2017, respectively |
|
22 |
|
|
|
21 |
|
|
Additional paid-in capital |
|
249,194 |
|
|
|
218,109 |
|
|
Retained earnings |
|
60,484 |
|
|
|
8,639 |
|
|
Accumulated other comprehensive income |
|
724 |
|
|
|
272 |
|
|
Total stockholders' equity |
|
310,424 |
|
|
|
227,041 |
|
|
Total liabilities and stockholders' equity |
$ |
375,898 |
|
|
$ |
275,072 |
|
See accompanying notes to the consolidated financial statements.
F-4
Consolidated Statements of Comprehensive Income
(amounts in thousands, except share and per share amounts)
|
|
Years ended December 31, |
|
|||||||||
|
|
2018 |
|
|
2017 |
|
|
2016 |
|
|||
|
Revenue |
|
|
|
|
|
|
|
|
|
|
|
|
Sales revenue |
$ |
336,015 |
|
|
$ |
225,492 |
|
|
$ |
168,170 |
|
|
Rental revenue |
|
22,096 |
|
|
|
23,946 |
|
|
|
34,659 |
|
|
Total revenue |
|
358,111 |
|
|
|
249,438 |
|
|
|
202,829 |
|
|
Cost of revenue |
|
|
|
|
|
|
|
|
|
|
|
|
Cost of sales revenue |
|
163,989 |
|
|
|
110,163 |
|
|
|
85,154 |
|
|
Cost of rental revenue, including depreciation of $7,567, $9,835 and |
|
|
|
|
|
|
|
|
|
|
|
|
$11,429, respectively |
|
15,542 |
|
|
|
18,038 |
|
|
|
20,365 |
|
|
Total cost of revenue |
|
179,531 |
|
|
|
128,201 |
|
|
|
105,519 |
|
|
Gross profit |
|
|
|
|
|
|
|
|
|
|
|
|
Gross profit-sales revenue |
|
172,026 |
|
|
|
115,329 |
|
|
|
83,016 |
|
|
Gross profit-rental revenue |
|
6,554 |
|
|
|
5,908 |
|
|
|
14,294 |
|
|
Total gross profit |
|
178,580 |
|
|
|
121,237 |
|
|
|
97,310 |
|
|
Operating expense |
|
|
|
|
|
|
|
|
|
|
|
|
Research and development |
|
7,029 |
|
|
|
5,313 |
|
|
|
5,113 |
|
|
Sales and marketing |
|
95,641 |
|
|
|
50,758 |
|
|
|
37,540 |
|
|
General and administrative |
|
38,018 |
|
|
|
37,576 |
|
|
|
31,793 |
|
|
Total operating expense |
|
140,688 |
|
|
|
93,647 |
|
|
|
74,446 |
|
|
Income from operations |
|
37,892 |
|
|
|
27,590 |
|
|
|
22,864 |
|
|
Other income (expense) |
|
|
|
|
|
|
|
|
|
|
|
|
Interest expense |
|
— |
|
|
|
— |
|
|
|
(6 |
) |
|
Interest income |
|
3,259 |
|
|
|
765 |
|
|
|
196 |
|
|
Other income (expense) |
|
(696 |
) |
|
|
1,301 |
|
|
|
(329 |
) |
|
Total other income (expense), net |
|
2,563 |
|
|
|
2,066 |
|
|
|
(139 |
) |
|
Income before provision (benefit) for income taxes |
|
40,455 |
|
|
|
29,656 |
|
|
|
22,725 |
|
|
Provision (benefit) for income taxes |
|
(11,390 |
) |
|
|
8,654 |
|
|
|
2,206 |
|
|
Net income |
|
51,845 |
|
|
|
21,002 |
|
|
|
20,519 |
|
|
Other comprehensive income (loss), net of tax |
|
|
|
|
|
|
|
|
|
|
|
|
Change in foreign currency translation adjustment |
|
31 |
|
|
|
363 |
|
|
|
— |
|
|
Change in net unrealized gains (losses) on foreign currency hedging |
|
981 |
|
|
|
(567 |
) |
|
|
55 |
|
|
Less: reclassification adjustment for net (gains) losses included in net income |
|
(577 |
) |
|
|
446 |
|
|
|
6 |
|
|
Total net change in unrealized gains (losses) on foreign currency hedging |
|
404 |
|
|
|
(121 |
) |
|
|
61 |
|
|
Change in net unrealized gains (losses) on marketable securities |
|
17 |
|
|
|
65 |
|
|
|
(59 |
) |
|
Total other comprehensive income, net of tax |
|
452 |
|
|
|
307 |
|
|
|
2 |
|
|
Comprehensive income |
$ |
52,297 |
|
|
$ |
21,309 |
|
|
$ |
20,521 |
|
|
|
|
|
|
|
|
|
|
|
|
|
|
|
Basic net income per share attributable to common stockholders (Note 2) |
$ |
2.44 |
|
|
$ |
1.02 |
|
|
$ |
1.02 |
|
|
Diluted net income per share attributable to common stockholders (Note 2) |
$ |
2.30 |
|
|
$ |
0.96 |
|
|
$ |
0.97 |
|
|
Weighted-average number of shares used in calculating net income per |
|
|
|
|
|
|
|
|
|
|
|
|
share attributable to common stockholders: |
|
|
|
|
|
|
|
|
|
|
|
|
Basic common shares |
|
21,266,696 |
|
|
|
20,683,807 |
|
|
|
20,067,152 |
|
|
Diluted common shares |
|
22,514,513 |
|
|
|
21,897,988 |
|
|
|
21,095,867 |
|
See accompanying notes to the consolidated financial statements.
F-5
Consolidated Statements of Stockholders’ Equity
(amounts in thousands, except share amounts)
|
|
|
|
|
|
|
|
|
|
Retained |
|
|
Accumulated |
|
|
|
|
|
|||||||
|
|
|
|
|
|
Additional |
|
|
earnings |
|
|
other |
|
|
Total |
|
|||||||||
|
|
|
Common stock |
|
|
paid-in |
|
|
(accumulated |
|
|
comprehensive |
|
|
stockholders' |
|
|||||||||
|
|
|
Shares |
|
|
Amount |
|
|
capital |
|
|
deficit) |
|
|
income (loss) |
|
|
equity |
|
||||||
|
Balance, December 31, 2015 |
|
|
19,782,403 |
|
|
|
20 |
|
|
|
179,143 |
|
|
|
(45,108 |
) |
|
|
(37 |
) |
|
|
134,018 |
|
|
Cumulative effect of change in accounting principle |
|
|
— |
|
|
|
— |
|
|
|
— |
|
|
|
12,226 |
|
|
|
— |
|
|
|
12,226 |
|
|
Stock-based compensation |
|
|
— |
|
|
|
— |
|
|
|
7,294 |
|
|
|
— |
|
|
|
— |
|
|
|
7,294 |
|
|
Employee stock purchases |
|
|
37,378 |
|
|
|
— |
|
|
|
1,055 |
|
|
|
— |
|
|
|
— |
|
|
|
1,055 |
|
|
Stock options exercised |
|
|
570,079 |
|
|
|
— |
|
|
|
6,974 |
|
|
|
— |
|
|
|
— |
|
|
|
6,974 |
|
|
Net income |
|
|
— |
|
|
|
— |
|
|
|
— |
|
|
|
20,519 |
|
|
|
— |
|
|
|
20,519 |
|
|
Other comprehensive income |
|
|
— |
|
|
|
— |
|
|
|
— |
|
|
|
— |
|
|
|
2 |
|
|
|
2 |
|
|
Balance, December 31, 2016 |
|
|
20,389,860 |
|
|
|
20 |
|
|
|
194,466 |
|
|
|
(12,363 |
) |
|
|
(35 |
) |
|
|
182,088 |
|
|
Stock-based compensation |
|
|
— |
|
|
|
— |
|
|
|
9,640 |
|
|
|
— |
|
|
|
— |
|
|
|
9,640 |
|
|
Employee stock purchases |
|
|
24,523 |
|
|
|
— |
|
|
|
1,379 |
|
|
|
— |
|
|
|
— |
|
|
|
1,379 |
|
|
Stock options exercised |
|
|
561,967 |
|
|
|
1 |
|
|
|
12,624 |
|
|
|
— |
|
|
|
— |
|
|
|
12,625 |
|
|
Net income |
|
|
— |
|
|
|
— |
|
|
|
— |
|
|
|
21,002 |
|
|
|
— |
|
|
|
21,002 |
|
|
Other comprehensive income |
|
|
— |
|
|
|
— |
|
|
|
— |
|
|
|
— |
|
|
|
307 |
|
|
|
307 |
|
|
Balance, December 31, 2017 |
|
|
20,976,350 |
|
|
$ |
21 |
|
|
$ |
218,109 |
|
|
$ |
8,639 |
|
|
$ |
272 |
|
|
$ |
227,041 |
|
|
Stock-based compensation |
|
|
— |
|
|
|
— |
|
|
|
12,790 |
|
|
|
— |
|
|
|
— |
|
|
|
12,790 |
|
|
Employee stock purchases |
|
|
25,532 |
|
|
|
— |
|
|
|
2,348 |
|
|
|
— |
|
|
|
— |
|
|
|
2,348 |
|
|
Restricted stock awards issued |
|
|
56,609 |
|
|
|
— |
|
|
|
— |
|
|
|
— |
|
|
|
— |
|
|
|
— |
|
|
Vesting of restricted stock units |
|
|
18,112 |
|
|
|
— |
|
|
|
— |
|
|
|
— |
|
|
|
— |
|
|
|
— |
|
|
Shares withheld related to net restricted stock settlement |
|
|
(6,290 |
) |
|
|
— |
|
|
|
(1,208 |
) |
|
|
— |
|
|
|
— |
|
|
|
(1,208 |
) |
|
Stock options exercised |
|
|
708,319 |
|
|
|
1 |
|
|
|
17,155 |
|
|
|
— |
|
|
|
— |
|
|
|
17,156 |
|
|
Net income |
|
|
— |
|
|
|
— |
|
|
|
— |
|
|
|
51,845 |
|
|
|
— |
|
|
|
51,845 |
|
|
Other comprehensive income |
|
|
— |
|
|
|
— |
|
|
|
— |
|
|
|
— |
|
|
|
452 |
|
|
|
452 |
|
|
Balance, December 31, 2018 |
|
|
21,778,632 |
|
|
$ |
22 |
|
|
$ |
249,194 |
|
|
$ |
60,484 |
|
|
$ |
724 |
|
|
$ |
310,424 |
|
See accompanying notes to the consolidated financial statements.
F-6
Consolidated Statements of Cash Flows
(amounts in thousands)
|
|
Years ended December 31, |
|
|||||||||
|
|
2018 |
|
|
2017 |
|
|
2016 |
|
|||
|
Cash flows from operating activities |
|
|
|
|
|
|
|
|
|
|
|
|
Net income |
$ |
51,845 |
|
|
$ |
21,002 |
|
|
$ |
20,519 |
|
|
Adjustments to reconcile net income to net cash provided by operating activities: |
|
|
|
|
|
|
|
|
|
|
|
|
Depreciation and amortization |
|
11,295 |
|
|
|
12,302 |
|
|
|
13,558 |
|
|
Loss on rental assets and other fixed assets |
|
1,160 |
|
|
|
1,136 |
|
|
|
1,202 |
|
|
Gain on sale of former rental assets |
|
(416 |
) |
|
|
(64 |
) |
|
|
(272 |
) |
|
Provision for sales returns and doubtful accounts |
|
17,518 |
|
|
|
13,773 |
|
|
|
11,082 |
|
|
Provision for rental revenue adjustments |
|
2,678 |
|
|
|
5,057 |
|
|
|
10,777 |
|
|
Provision for inventory losses |
|
351 |
|
|
|
340 |
|
|
|
133 |
|
|
Stock-based compensation expense |
|
12,790 |
|
|
|
9,640 |
|
|
|
7,294 |
|
|
Deferred income taxes |
|
(11,595 |
) |
|
|
7,947 |
|
|
|
1,036 |
|
|
Changes in operating assets and liabilities: |
|
|
|
|
|
|
|
|
|
|
|
|
Accounts receivable |
|
(25,963 |
) |
|
|
(18,263 |
) |
|
|
(32,738 |
) |
|
Inventories |
|
(9,972 |
) |
|
|
(5,894 |
) |
|
|
(7,458 |
) |
|
Deferred cost of revenue |
|
2 |
|
|
|
37 |
|
|
|
(1 |
) |
|
Income tax receivable |
|
(1,348 |
) |
|
|
(875 |
) |
|
|
1,725 |
|
|
Prepaid expenses and other current assets |
|
(4,526 |
) |
|
|
(819 |
) |
|
|
(789 |
) |
|
Other noncurrent assets |
|
(1,626 |
) |
|
|
— |
|
|
|
— |
|
|
Accounts payable and accrued expenses |
|
6,360 |
|
|
|
7,438 |
|
|
|
(86 |
) |
|
Accrued payroll |
|
4,538 |
|
|
|
722 |
|
|
|
852 |
|
|
Warranty reserve |
|
3,359 |
|
|
|
2,689 |
|
|
|
1,507 |
|
|
Deferred revenue |
|
3,360 |
|
|
|
3,654 |
|
|
|
2,759 |
|
|
Income tax payable |
|
64 |
|
|
|
225 |
|
|
|
(11 |
) |
|
Other noncurrent liabilities |
|
103 |
|
|
|
447 |
|
|
|
(55 |
) |
|
Net cash provided by operating activities |
|
59,977 |
|
|
|
60,494 |
|
|
|
31,034 |
|
|
Cash flows from investing activities |
|
|
|
|
|
|
|
|
|
|
|
|
Purchases of marketable securities |
|
(76,162 |
) |
|
|
(46,933 |
) |
|
|
(33,142 |
) |
|
Maturities of marketable securities |
|
63,455 |
|
|
|
37,041 |
|
|
|
28,843 |
|
|
Investment in intangible assets |
|
(350 |
) |
|
|
(3,316 |
) |
|
|
(113 |
) |
|
Investment in property and equipment |
|
(8,043 |
) |
|
|
(2,914 |
) |
|
|
(1,718 |
) |
|
Production and purchase of rental equipment |
|
(4,580 |
) |
|
|
(3,997 |
) |
|
|
(6,185 |
) |
|
Proceeds from sale of former assets |
|
715 |
|
|
|
183 |
|
|
|
388 |
|
|
Payment for acquisition, net of cash acquired |
|
— |
|
|
|
(4,494 |
) |
|
|
— |
|
|
Net cash used in investing activities |
|
(24,965 |
) |
|
|
(24,430 |
) |
|
|
(11,927 |
) |
See accompanying notes to the consolidated financial statements.
F-7
Consolidated Statements of Cash Flows (continued)
(amounts in thousands)
|
|
Years ended December 31, |
|
|||||||||
|
Cash flows from financing activities |
2018 |
|
|
2017 |
|
|
2016 |
|
|||
|
Proceeds from stock options exercised |
|
17,156 |
|
|
|
12,625 |
|
|
|
6,974 |
|
|
Proceeds from employee stock purchases |
|
2,348 |
|
|
|
1,379 |
|
|
|
1,055 |
|
|
Payment of employment taxes related to release of restricted stock |
|
(1,208 |
) |
|
|
— |
|
|
|
— |
|
|
Repayment of debt from investment in intangible assets |
|
— |
|
|
|
— |
|
|
|
(315 |
) |
|
Net cash provided by financing activities |
|
18,296 |
|
|
|
14,004 |
|
|
|
7,714 |
|
|
Effect of exchange rates on cash |
|
373 |
|
|
|
34 |
|
|
|
(76 |
) |
|
Net increase in cash and cash equivalents |
|
53,681 |
|
|
|
50,102 |
|
|
|
26,745 |
|
|
Cash and cash equivalents, beginning of period |
|
142,953 |
|
|
|
92,851 |
|
|
|
66,106 |
|
|
Cash and cash equivalents, end of period |
$ |
196,634 |
|
|
$ |
142,953 |
|
|
$ |
92,851 |
|
|
|
|
|
|
|
|
|
|
|
|
|
|
|
Supplemental disclosures of cash flow information |
|
|
|
|
|
|
|
|
|
|
|
|
Cash paid during the period for interest |
$ |
— |
|
|
$ |
— |
|
|
$ |
10 |
|
|
Cash paid (received) during the period for income taxes, net of refunds received |
|
1,653 |
|
|
|
1,267 |
|
|
|
(447 |
) |
|
Supplemental disclosures of non-cash transactions |
|
|
|
|
|
|
|
|
|
|
|
|
Property and equipment in account payable and accrued expenses |
|
125 |
|
|
|
70 |
|
|
|
— |
|
See accompanying notes to the consolidated financial statements.
F-8
Notes to the Consolidated Financial Statements
(amounts in thousands, except share and per share amounts)
1. Nature of business
Inogen, Inc. (Company or Inogen) was incorporated in Delaware on November 27, 2001. The Company is a medical technology company that primarily develops, manufactures and markets innovative portable oxygen concentrators used to deliver supplemental long-term oxygen therapy to patients suffering from chronic respiratory conditions. Traditionally, these patients have relied on stationary oxygen concentrator systems for use in the home and oxygen tanks or cylinders for mobile use, which the Company calls the delivery model. The tanks and cylinders must be delivered regularly and have a finite amount of oxygen, which requires patients to plan activities outside of their homes around delivery schedules and a finite oxygen supply. Additionally, patients must attach long, cumbersome tubing to their stationary concentrators simply to enable mobility within their homes. The Company’s proprietary Inogen One® systems concentrate the air around the patient to offer a single source of supplemental oxygen anytime, anywhere with a single battery and can be plugged into an outlet when at home, in a car, or in a public place with outlets available. The Company’s Inogen One systems reduce the patient’s reliance on stationary concentrators and scheduled deliveries of tanks with a finite supply of oxygen, thereby improving patient quality of life and fostering mobility.
Since adopting the Company’s direct-to-consumer rental strategy in 2009, the Company has directly sold or rented more than 567,000 of its Inogen oxygen concentrators as of December 31, 2018.
The Company incorporated Inogen Europe Holding B.V., a Dutch limited liability company, on April 13, 2017. The Company owned all outstanding stock of Inogen Europe Holding B.V., which became a wholly owned subsidiary of the Company.
On May 4, 2017, Inogen Europe Holding B.V. acquired all issued and outstanding capital stock of MedSupport Systems B.V. (MedSupport) and began operating under the name Inogen Europe B.V. for approximately $5,831 comprised of $5,779 of cash paid at closing and net working capital adjustments of approximately $52 paid in the fourth quarter of 2017. In aggregate, $1,337 was cash acquired, $1,529 was attributed to intangible assets, $2,154 was attributed to goodwill, and $811 was attributed to net assets assumed. MedSupport is engaged in the business of importing and distributing medical devices throughout Europe. The acquisition allows the Company to add a European customer support and repair site in the Netherlands and is currently operating as Inogen Europe B.V. Goodwill associated with this acquisition is not deductible for tax purposes in the Netherlands. Acquisition expenses of approximately $370 were expensed in 2017 and classified within general and administrative expense. Pro forma results of operations for this acquisition have not been presented because they are not material to the consolidated results of operations.
The Company merged Inogen Europe Holding B.V. and Inogen Europe B.V. on December 28, 2018.
2. Summary of significant accounting policies
Basis of presentation
The consolidated financial statements of the Company have been prepared in accordance with accounting principles generally accepted in the United States of America (U.S. GAAP).
Basis of consolidation
The consolidated financial statements include the accounts of Inogen, Inc. and its wholly owned subsidiaries. All intercompany balances and transactions have been eliminated.
F-9
The preparation of consolidated financial statements in conformity with U.S. GAAP requires management to make estimates and assumptions that affect the reported amounts of assets and liabilities and disclosure of contingent assets and liabilities at the date of the consolidated financial statements and the reported amounts of revenues and expenses during the reporting period. Management bases these estimates and assumptions upon historical experience, existing and known circumstances, authoritative accounting pronouncements and other factors that management believes to be reasonable. Significant areas requiring the use of management estimates relate to revenue recognition and determining the stand-alone selling price (SSP) of performance obligations, inventory and rental asset valuations and write-downs, accounts receivable allowances for bad debts, returns and adjustments, warranty expense, stock compensation expense, depreciation and amortization, income tax provision and uncertain tax positions, fair value of financial instruments, and fair value of acquired intangible assets and goodwill. Actual results could differ from these estimates.
Revenue
The Company generates revenue primarily from sales and rentals of its products. The Company’s products consist of its proprietary line of oxygen concentrators and related accessories. Other revenue, which is included in sales revenue on the Statements of Comprehensive Income, primarily comes from service contracts, replacement parts and freight revenue for product shipments.
Sales revenue
Revenue is recognized upon transfer of control of promised products or services to customers in an amount that reflects the consideration the Company expects to receive in exchange for those products or services. Revenue from product sales is generally recognized upon shipment of the product but is deferred for certain transactions when control has not yet transferred to the customer.
The Company’s product is generally sold with a right of return and the Company may provide other incentives, which are accounted for as variable consideration when estimating the amount of revenue to recognize. Returns and incentives are estimated at the time sales revenue is recognized. The provisions for estimated returns are made based on known claims and estimates of additional returns based on historical data and future expectations. Sales revenue incentives within the Company’s contracts are estimated based on the most likely amounts expected on the related sales transaction and recorded as a reduction to revenue at the time of sale in accordance with the terms of the contract. Accordingly, revenue is recognized net of allowances for estimated returns and incentives.
The Company also offers a lifetime warranty for direct-to-consumer sales of its portable oxygen concentrators. For a fixed price, the Company agrees to provide a fully functional portable oxygen concentrator for the remaining life of the patient. Lifetime warranties are only offered to patients upon the initial sale of portable oxygen concentrators directly from the Company and are non-transferable. Lifetime warranties are considered to be a distinct performance obligation that are accounted for separately from its sale of portable oxygen concentrators with a standard warranty of three years.
The revenue is allocated to the distinct lifetime warranty performance obligation based on a relative SSP method. The Company has vendor-specific objective evidence of the selling price for its equipment. To determine the selling price of the lifetime warranty, the Company uses its best estimate of the SSP for the distinct performance obligation as the lifetime warranty is neither separately priced nor is the selling price available through third-party evidence. To calculate the selling price associated with the lifetime warranties, management considers the profit margins of service revenue, the average estimated cost of lifetime warranties and the price of extended warranties. Revenue from the distinct lifetime warranty is deferred after the delivery of the equipment and recognized based on an estimated mortality rate over five years, which is the estimated performance period of the contract based on the average patient life expectancy.
Revenue from the sale of the Company’s repair services is recognized when the performance obligations are satisfied and collection of the receivables is probable. Other revenue from the sale of replacement parts is generally recognized when product is shipped to customers.
Freight revenue consists of fees associated with the deployment of products internationally and domestically when expedited freight options are requested or when minimum order quantities are not met. Freight revenue is generally recognized upon shipment of the product but is deferred if control has not yet transferred to the customer. Shipping and handling costs for sold products and rental assets shipped to the Company’s customers are included on the consolidated statement of comprehensive income as part of cost of sales revenue and cost of rental revenue, respectively.
F-10
The payment terms and conditions of customer contracts vary by customer type and the products and services offered. For certain products or services and customer types, the Company requires payment before the products or services are delivered to the customer. The timing of sales revenue recognition, billing and cash collection results in billed accounts receivable and deferred revenue in the consolidated balance sheet.
Contract liabilities primarily consist of deferred revenue related to lifetime warranties on direct-to-consumer sales revenue when cash payments are received in advance of services performed under the contract. The contract with the customer states the final terms of the sale, including the description, quantity, and price of each product or service purchase. The increase in deferred revenue related to lifetime warranties were primarily driven by $6,909 and $4,290 of payments received in advance of satisfying performance obligations for the years ended December 31, 2018 and December 31, 2017, respectively, partially offset by $2,855 and $752 of revenues recognized that were included in the deferred revenue balances as of December 31, 2017 and December 31, 2016, respectively. Deferred revenue related to lifetime warranties was $14,874 and $10,820 as of December 31, 2018 and December 31, 2017, respectively, and is classified within deferred revenue – current and noncurrent deferred revenue in the consolidated balance sheet.
The Company elected to apply the practical expedient in accordance with Accounting Standards Codification (ASC) 606—Revenue Recognition and did not evaluate contracts of one year or less for the existence of a significant financing component. The Company does not expect any revenue to be recognized over a multi-year period with the exception of revenue related to lifetime warranties.
The Company’s sales revenue is primarily derived from the sale of its Inogen One systems, Inogen At Home systems, and related accessories to individual consumers, home medical equipment providers, distributors, the Company’s private label partner and resellers worldwide. Sales revenue is classified into two areas: business-to-business sales and direct-to-consumer sales. The following table sets forth the Company’s sales revenue disaggregated by sales channel and geographic region:
|
(amounts in thousands) |
|
Years ended December 31, |
|
|||||||||
|
Revenue by region and category |
|
2018 |
|
|
2017 |
|
|
2016 |
|
|||
|
Business-to-business domestic sales |
|
$ |
116,581 |
|
|
$ |
83,390 |
|
|
$ |
56,605 |
|
|
Business-to-business international sales |
|
|
77,333 |
|
|
|
55,519 |
|
|
|
50,106 |
|
|
Direct-to-consumer domestic sales |
|
|
142,101 |
|
|
|
86,583 |
|
|
|
61,459 |
|
|
Total sales revenue |
|
$ |
336,015 |
|
|
$ |
225,492 |
|
|
$ |
168,170 |
|
Rental revenue
The Company recognizes equipment rental revenue over the non-cancelable lease term, which is one month, less estimated adjustments, in accordance with ASC 840—Leases. The Company has separate contracts with each patient that are not subject to a master lease agreement with any third-party payor. The Company evaluates the individual lease contracts at lease inception and the start of each monthly renewal period to determine if there is reasonable assurance that the bargain renewal option associated with the potential capped free rental period would be exercised. Historically, the exercise of such bargain renewal option is not reasonably assured at lease inception and most subsequent monthly lease renewal periods. If the Company determines that the reasonable assurance threshold for an individual patient is met at lease inception or at a monthly lease renewal period, such determination would impact the bargain renewal period for an individual lease. The Company would first consider the lease classification issue (sales-type lease or operating lease) and then appropriately recognize or defer rental revenue over the lease term, which may include a portion of the capped rental period. The Company deferred $0 associated with the capped rental period as of December 31, 2018 and December 31, 2017.
The lease term begins on the date products are shipped to patients and are recorded at amounts estimated to be received under reimbursement arrangements with third-party payors, including Medicare, private payors, and Medicaid. Due to the nature of the industry and the reimbursement environment in which the Company operates, certain estimates are required to record net revenue and accounts receivable at their net realizable values. Inherent in these estimates is the risk that they will have to be revised or updated as additional information becomes available. Specifically, the complexity of many third-party billing arrangements and the uncertainty of reimbursement amounts for certain services from certain payors may result in adjustments to amounts originally recorded. Such adjustments are typically identified and recorded at the point of cash application, claim denial or account review. The Company adjusts revenue for historical trends on revenue adjustments due to timely filings, deaths, hospice, and other types of analyzable adjustments on a monthly basis. Accounts receivable are reduced by an allowance for doubtful accounts which provides for those accounts from which payment is not expected to be received although product was delivered and revenue was earned. The determination that an account is uncollectable and the ultimate write-off of that account occurs once collection is considered to be highly unlikely, and it is written-off and charged to the allowance at that time. Amounts billed but not earned due to the timing of the billing cycle are deferred and recognized in revenue on a straight-line basis over the monthly billing period. For example, if the first day of the billing period does not fall on the first of the month, then a portion of the monthly billing period will fall in the subsequent month and the related revenue and cost would be deferred based on the service days in the following month.
F-11
Rental revenue is recognized as earned, less estimated adjustments. Revenue not billed at the end of the period is reviewed for the likelihood of collections and accrued. The rental revenue stream is not guaranteed and payment will cease if the patient no longer needs oxygen or returns the equipment. Revenue recognized is at full estimated allowable amounts; transfers to secondary insurances or patient responsibility have no net effect on revenue. Rental revenue is earned for that entire month if the patient is on service on the first day of the 30-day period commencing on the recurring date of service for a particular claim, regardless if there is a change in condition or death after that date.
Included in rental revenue are unbilled amounts for which the revenue recognition criteria had been met as of period-end but were not yet billed to the payor. The estimate of net unbilled rental revenue recognized is based on historical trends and estimates of future collectability. In addition, the Company estimates potential future adjustments and write-offs of these unbilled amounts and includes these estimates in the allowance for adjustments and write-offs of rental revenue which is netted against gross receivables.
Fair value of financial instruments
The Company’s financial instruments consist of cash and cash equivalents, marketable securities, accounts receivable, accounts payable and accrued expenses. The carrying values of its financial instruments approximate fair value based on their short-term nature.
Imputed interest associated with the Company’s non-interest bearing debt was insignificant and was appropriately recognized in the respective periods.
Fair value accounting
ASC 820—Fair Value Measurements and Disclosures creates a single definition of fair value, establishes a framework for measuring fair value in U.S. GAAP and expands disclosures about fair value measurements. ASC 820 emphasizes that fair value is a market-based measurement, not an entity-specific measurement, and states that a fair value measurement is to estimate the price at which an orderly transaction to sell an asset or to transfer the liability would take place between market participants at the measurement date under current market conditions. Assets and liabilities adjusted to fair value in the balance sheet are categorized based upon the level of judgment associated with the inputs used to measure their fair value. Level inputs, as defined by ASC 820, are as follows:
|
Level input |
|
Input definition |
|
Level 1 |
|
Inputs are unadjusted, quoted prices for identical assets or liabilities in active markets at the measurement date. |
|
Level 2 |
|
Inputs, other than quoted prices included in Level 1 that are observable for the asset or liability through corroboration with market data at the measurement date. |
|
Level 3 |
|
Unobservable inputs that reflect management’s best estimate of what market participants would use in pricing the asset or liability at the measurement date. |
The Company obtained the fair value of its available-for-sale securities, which are not in active markets, from a third-party professional pricing service using quoted market prices for identical or comparable instruments, rather than direct observations of quoted prices in active markets. The Company's professional pricing service gathers observable inputs for all of its fixed income securities from a variety of industry data providers (e.g., large custodial institutions) and other third-party sources. Once the observable inputs are gathered, all data points are considered and the fair value is determined. The Company validates the quoted market prices provided by its primary pricing service by comparing their assessment of the fair values against the fair values provided by its investment managers. The Company's investment managers use similar techniques to its professional pricing service to derive pricing as described above. As all significant inputs were observable, derived from observable information in the marketplace or supported by observable levels at which transactions are executed in the marketplace, the Company has classified its marketable securities within Level 2 of the fair value hierarchy.
F-12
The following table summarizes fair value measurements by level for the assets measured at fair value on a recurring basis for cash, cash equivalents and marketable securities:
|
|
|
As of December 31, 2018 |
|
|||||||||||||||||
|
|
|
|
|
|
|
Gross |
|
|
|
|
|
|
Cash |
|
|
|
|
|
||
|
|
|
Adjusted |
|
|
unrealized |
|
|
|
|
|
|
and cash |
|
|
Marketable |
|
||||
|
(amounts in thousands) |
|
cost |
|
|
gains (losses) |
|
|
Fair value |
|
|
equivalents |
|
|
securities |
|
|||||
|
Cash |
|
$ |
33,671 |
|
|
$ |
— |
|
|
$ |
33,671 |
|
|
$ |
33,671 |
|
|
$ |
— |
|
|
Level 1: |
|
|
|
|
|
|
|
|
|
|
|
|
|
|
|
|
|
|
|
|
|
Money market accounts |
|
|
158,438 |
|
|
|
— |
|
|
|
158,438 |
|
|
|
158,438 |
|
|
|
— |
|
|
|
|
|
|
|
|
|
|
|
|
|
|
|
|
|
|
|
|
|
|
|
|
Level 2: |
|
|
|
|
|
|
|
|
|
|
|
|
|
|
|
|
|
|
|
|
|
Corporate bonds |
|
|
13,629 |
|
|
|
(16 |
) |
|
|
13,613 |
|
|
|
— |
|
|
|
13,613 |
|
|
U.S. Treasury securities |
|
|
34,620 |
|
|
|
7 |
|
|
|
34,627 |
|
|
|
4,525 |
|
|
|
30,102 |
|
|
Total |
|
$ |
240,358 |
|
|
$ |
(9 |
) |
|
$ |
240,349 |
|
|
$ |
196,634 |
|
|
$ |
43,715 |
|
|
|
|
|
|
|
|
|
|
|
|
|
|
|
|
|
|
|
|
|
|
|
|
|
|
As of December 31, 2017 |
|
|||||||||||||||||
|
|
|
|
|
|
|
Gross |
|
|
|
|
|
|
Cash |
|
|
|
|
|
||
|
|
|
Adjusted |
|
|
unrealized |
|
|
|
|
|
|
and cash |
|
|
Marketable |
|
||||
|
(amounts in thousands) |
|
cost |
|
|
losses |
|
|
Fair value |
|
|
equivalents |
|
|
securities |
|
|||||
|
Cash |
|
$ |
46,237 |
|
|
$ |
— |
|
|
$ |
46,237 |
|
|
$ |
46,237 |
|
|
$ |
— |
|
|
Level 1: |
|
|
|
|
|
|
|
|
|
|
|
|
|
|
|
|
|
|
|
|
|
Money market accounts |
|
|
93,430 |
|
|
|
— |
|
|
|
93,430 |
|
|
|
93,430 |
|
|
|
— |
|
|
|
|
|
|
|
|
|
|
|
|
|
|
|
|
|
|
|
|
|
|
|
|
Level 2: |
|
|
|
|
|
|
|
|
|
|
|
|
|
|
|
|
|
|
|
|
|
Certificates of deposit |
|
|
11,010 |
|
|
|
(4 |
) |
|
|
11,006 |
|
|
|
490 |
|
|
|
10,516 |
|
|
Corporate bonds |
|
|
20,789 |
|
|
|
(21 |
) |
|
|
20,768 |
|
|
|
2,796 |
|
|
|
17,972 |
|
|
Agency mortgage-backed securities |
|
|
2,005 |
|
|
|
(1 |
) |
|
|
2,004 |
|
|
|
— |
|
|
|
2,004 |
|
|
U.S. Treasury securities |
|
|
499 |
|
|
|
— |
|
|
|
499 |
|
|
|
— |
|
|
|
499 |
|
|
Total |
|
$ |
173,970 |
|
|
$ |
(26 |
) |
|
$ |
173,944 |
|
|
$ |
142,953 |
|
|
$ |
30,991 |
|
The following table summarizes the estimated fair value of the Company’s investments in marketable securities, classified by the contractual maturity date of the securities:
|
|
December 31, |
|
|
|
(amounts in thousands) |
2018 |
|
|
|
Due within one year |
$ |
43,715 |
|
|
Due in one year through five years |
|
— |
|
|
Total |
$ |
43,715 |
|
Derivative instruments and hedging activities
The Company transacts business in foreign currencies and has international sales and expenses denominated in foreign currencies, subjecting the Company to foreign currency risk. The Company has entered into foreign currency forward contracts, generally with maturities of twelve months or less, to reduce the volatility of cash flows primarily related to forecasted revenue denominated in certain foreign currencies. These contracts allow the Company to sell Euros in exchange for U.S. dollars at specified contract rates. Forward contracts are used to hedge forecasted sales over specific months. Changes in the fair value of these forward contracts designed as cash flow hedges are recorded as a component of accumulated other comprehensive income (loss) income within stockholders’ equity and are recognized in the consolidated statements of comprehensive income during the period which approximates the time the corresponding sales occur. The Company may also enter into foreign exchange contracts that are not designated as hedging instruments for financial accounting purposes. These contracts are generally entered into to offset the gains and losses on certain asset and liability balances until the expected time of repayment. Accordingly, any gains or losses resulting from changes in the fair value of the non-designated contracts are reported in other expense, net in the consolidated statements of comprehensive income. The gains and losses on these contracts generally offset the gains and losses associated with the underlying foreign currency-denominated balances, which are also reported in other income (expense), net.
F-13
The Company records the assets or liabilities associated with derivative instruments and hedging activities at fair value based on Level 2 inputs in other current assets or other current liabilities, respectively, in the consolidated balance sheet. The Company had a receivable of $472 and a payable of $66 as of December 31, 2018 and 2017, respectively. The Company classifies the foreign currency derivative instruments within Level 2 in the fair value hierarchy as the valuation inputs are based on quoted prices and market observable data of whether it is designated and qualifies for hedge accounting.
The Company documents the hedging relationship and its risk management objective and strategy for undertaking the hedge, the hedging instrument, the hedged transaction, the nature of the risk being hedged, how the hedging instrument’s effectiveness in offsetting the hedged risk will be assessed prospectively and retrospectively, and a description of the method used to measure ineffectiveness. The Company assesses hedge effectiveness and ineffectiveness at a minimum quarterly but may assess it monthly. For derivative instruments that are designed and qualify as part of a cash flow hedging relationship, the effective portion of the gain or loss on the derivative is reported in other comprehensive income (loss) and reclassified into earnings in the same periods during which the hedged transaction affects earnings. Gains and losses on the derivative representing either hedge ineffectiveness or hedge components excluded from the assessment of effectiveness are recognized in current period earnings.
The Company will discontinue hedge accounting prospectively when it determines that the derivative is no longer effective in offsetting cash flows attributable to the hedge risk. The cash flow hedge is de-designated because a forecasted transaction is not probable of occurring, or management determines to remove the designation of the cash flow hedge. In all situations in which hedge accounting is discontinued and the derivative remains outstanding, the Company continues to carry the derivative at its fair value on the balance sheet and recognizes any subsequent changes in the fair value in earnings. When it is probable that a forecasted transaction will not occur, the Company will discontinue hedge accounting and recognize immediately in earnings gains and losses that were accumulated in other comprehensive income (loss) related to the hedging relationship.
Accumulated other comprehensive income (loss)
The components of accumulated other comprehensive income (loss) were as follows:
|
|
As of December 31, 2018 |
|
|||||||||||||
|
|
Foreign |
|
|
Unrealized |
|
|
Unrealized |
|
|
Accumulated |
|
||||
|
|
currency |
|
|
gains (losses) on |
|
|
gains (losses) |
|
|
other |
|
||||
|
|
translation |
|
|
marketable |
|
|
on cash |
|
|
comprehensive |
|
||||
|
(amounts in thousands) |
adjustments |
|
|
securities |
|
|
flow hedges |
|
|
income |
|
||||
|
Balance as of December 31, 2017 |
$ |
363 |
|
|
$ |
(17 |
) |
|
$ |
(74 |
) |
|
$ |
272 |
|
|
Other comprehensive gain |
|
31 |
|
|
|
17 |
|
|
|
404 |
|
|
|
452 |
|
|
Balance as of December 31, 2018 |
$ |
394 |
|
|
$ |
— |
|
|
$ |
330 |
|
|
$ |
724 |
|
|
|
|
|
|
|
|
|
|
|
|
|
|
|
|
|
|
|
|
As of December 31, 2017 |
|
|||||||||||||
|
|
Foreign |
|
|
Unrealized |
|
|
Unrealized |
|
|
Accumulated |
|
||||
|
|
currency |
|
|
gains (losses) on |
|
|
gains (losses) |
|
|
other |
|
||||
|
|
translation |
|
|
marketable |
|
|
on cash |
|
|
comprehensive |
|
||||
|
(amounts in thousands) |
adjustments |
|
|
securities |
|
|
flow hedges |
|
|
income (loss) |
|
||||
|
Balance as of December 31, 2016 |
$ |
— |
|
|
$ |
(82 |
) |
|
$ |
47 |
|
|
$ |
(35 |
) |
|
Other comprehensive gain (loss) |
|
363 |
|
|
|
65 |
|
|
|
(121 |
) |
|
|
307 |
|
|
Balance as of December 31, 2017 |
$ |
363 |
|
|
$ |
(17 |
) |
|
$ |
(74 |
) |
|
$ |
272 |
|
Comprehensive income (loss) is the total net earnings and all other non-owner changes in equity. Except for net income and unrealized gains and losses on cash flow hedges, the Company does not have any transactions or other economic events that qualify as comprehensive income (loss).
Cash, cash equivalents, and marketable securities
The Company considers all short-term highly liquid investments with a maturity of three months or less to be cash equivalents. The Company’s marketable debt securities have been classified and accounted for as available-for-sale. Cash equivalents are recorded at cost plus accrued interest, which is considered adjusted cost, and approximates fair value. Marketable debt securities are included in cash equivalents and marketable securities based on the maturity date of the security. Short-term investments are included in marketable securities in the current period presentation.
F-14
The Company considers investments with maturities greater than three months, but less than one year, to be marketable securities. Investments are reported at fair value with realized and unrealized gains or losses reported in other income (expense), net.
The Company reviews its investments to identify and evaluate investments that have an indication of possible impairment. Factors considered in determining whether a loss is temporary include the length of time and extent to which fair value has been less than the cost basis, the financial condition and near-term prospects of the investee, and the Company's intent and ability to hold the investment for a period of time sufficient to allow for any anticipated recovery in market value. Credit losses and other-than-temporary impairments are declines in fair value that are not expected to recover and are charged to other income (expense), net. Cash, cash equivalents, and marketable securities consist of the following:
|
(amounts in thousands) |
December 31, |
|
|||||
|
Cash and cash equivalents |
2018 |
|
|
2017 |
|
||
|
Cash |
$ |
33,671 |
|
|
$ |
46,237 |
|
|
Money market accounts |
|
158,438 |
|
|
|
93,430 |
|
|
Certificates of deposit |
|
— |
|
|
|
490 |
|
|
Corporate bonds |
|
— |
|
|
|
2,796 |
|
|
U.S. Treasury securities |
|
4,525 |
|
|
|
— |
|
|
Total cash and cash equivalents |
$ |
196,634 |
|
|
$ |
142,953 |
|
|
Marketable securities |
|
|
|
|
|
|
|
|
Certificates of deposit |
$ |
— |
|
|
$ |
10,516 |
|
|
Corporate bonds |
|
13,613 |
|
|
|
17,972 |
|
|
Agency mortgage-backed securities |
|
— |
|
|
|
2,004 |
|
|
U. S. Treasury securities |
|
30,102 |
|
|
|
499 |
|
|
Total marketable securities |
$ |
43,715 |
|
|
$ |
30,991 |
|
Accounts receivable and allowance for bad debts, returns, and adjustments
Accounts receivable are customer obligations due under normal sales and rental terms. The Company performs credit evaluations of the customers’ financial condition and generally does not require collateral. The allowance for doubtful accounts is maintained at a level that, in management’s opinion, is adequate to absorb potential losses related to accounts receivable and is based upon the Company’s continuous evaluation of the collectability of outstanding balances. Management’s evaluation takes into consideration such factors as past bad debt experience, economic conditions and information about specific receivables. The Company’s evaluation also considers the age and composition of the outstanding amounts in determining their net realizable value.
The allowance for doubtful accounts is based on estimates, and ultimate losses may vary from current estimates. As adjustments to these estimates become necessary, they are reported in general and administrative expense in the periods in which they become known. This allowance is increased by bad debt provisions charged to bad debt expense, net of recoveries, in operating expense and is reduced by direct write-offs.
The Company generally does not allow returns from providers for reasons not covered under its standard warranty. Therefore, provision for returns applies primarily to direct-to-consumer sales. This reserve is calculated based on actual historical return rates under the Company’s 30-day return program and is applied to the related sales revenue for the last month of the quarter reported.
The Company also records an allowance for rental revenue adjustments which is recorded as a reduction of rental revenue and net rental accounts receivable balances. These adjustments result from contractual adjustments, audit adjustments, untimely claims filings, or billings not paid due to another provider performing same or similar functions for the patient in the same period, all of which prevent billed revenue from becoming realizable. The reserve is based on historical revenue adjustments as a percentage of rental revenue billed and unbilled during the related period.
When recording the allowance for doubtful accounts, the bad debt expense account (general and administrative expense account) is charged; when recording allowance for sales returns, the sales returns account (contra sales revenue account) is charged; and when recording the allowance for rental reserve adjustments, the rental revenue adjustments account (contra rental revenue account) is charged.
F-15
As of December 31, 2018 and December 31, 2017, included in accounts receivable on the consolidated balance sheets were earned but unbilled receivables of $589 and $1,470, respectively. These balances reflect gross unbilled receivables prior to any allowances for adjustments and write-offs. The Company consistently applies its allowance estimation methodology from period-to-period. The Company’s best estimate is made on an accrual basis and adjusted in future periods as required. Any adjustments to the prior period estimates are included in the current period. As additional information becomes known, the Company adjusts its assumptions accordingly to change its estimate of the allowance. For the years ended December 31, 2018 and December 31, 2017, the Company had increases of $1,757 and $3,442, respectively, in the provision for bad debt and revenue adjustments related to prior years.
Gross accounts receivable balance concentrations by major category as of December 31, 2018 and December 31, 2017 were as follows:
|
|
|
As of |
|
|
As of |
|
||||||||||
|
(amounts in thousands) |
|
December 31, 2018 |
|
|
December 31, 2017 |
|
||||||||||
|
Gross accounts receivable |
|
$ |
|
|
% |
|
|
$ |
|
|
% |
|
||||
|
Rental (1) |
|
$ |
3,406 |
|
|
|
8.7 |
% |
|
$ |
6,236 |
|
|
|
18.0 |
% |
|
Business-to-business and other receivables (2) |
|
|
35,656 |
|
|
|
91.3 |
% |
|
|
28,474 |
|
|
|
82.0 |
% |
|
Total gross accounts receivable |
|
$ |
39,062 |
|
|
|
100.0 |
% |
|
$ |
34,710 |
|
|
|
100.0 |
% |
Net accounts receivable (gross accounts receivable, net of allowances) balance concentrations by major category as of December 31, 2018 and December 31, 2017 were as follows:
|
|
|
As of |
|
|
As of |
|
||||||||||
|
(amounts in thousands) |
|
December 31, 2018 |
|
|
December 31, 2017 |
|
||||||||||
|
Net accounts receivable |
|
$ |
|
|
% |
|
|
$ |
|
|
% |
|
||||
|
Rental (1) |
|
$ |
2,413 |
|
|
|
6.5 |
% |
|
$ |
4,212 |
|
|
|
13.4 |
% |
|
Business-to-business and other receivables (2) |
|
|
34,628 |
|
|
|
93.5 |
% |
|
|
27,232 |
|
|
|
86.6 |
% |
|
Total net accounts receivable |
|
$ |
37,041 |
|
|
|
100.0 |
% |
|
$ |
31,444 |
|
|
|
100.0 |
% |
|
(1) |
Rental includes Medicare, Medicaid/other government, private insurance and patient pay. |
|
(2) |
Business-to business receivables included one customer with a gross accounts receivable balance of $16,198 and $10,394 as of December 31, 2018 and December 31, 2017, respectively. This customer received extended payment terms through a direct financing plan offered. The Company also has a credit insurance policy in place, which allocated up to $18,000 in coverage as of December 31, 2018 and allocated up to $12,000 in coverage as of December 31, 2017 for this customer with a $400 deductible and 10% retention. |
The following table sets forth the percentage breakdown of the Company’s net accounts receivable (gross accounts receivable net of allowances) by aging category by invoice due date as of December 31, 2018 and December 31, 2017.
|
|
|
As of |
|
|
As of |
|
||||||||||
|
(amounts in thousands) |
|
December 31, 2018 |
|
|
December 31, 2017 |
|
||||||||||
|
Net accounts receivable by aging category |
|
$ |
|
|
% |
|
|
$ |
|
|
% |
|
||||
|
Held and Unbilled |
|
$ |
80 |
|
|
|
0.2 |
% |
|
$ |
537 |
|
|
|
1.7 |
% |
|
Aged 0-90 days |
|
|
36,245 |
|
|
|
97.9 |
% |
|
|
29,237 |
|
|
|
93.0 |
% |
|
Aged 91-180 days |
|
|
425 |
|
|
|
1.1 |
% |
|
|
435 |
|
|
|
1.4 |
% |
|
Aged 181-365 days |
|
|
234 |
|
|
|
0.6 |
% |
|
|
602 |
|
|
|
1.9 |
% |
|
Aged over 365 days |
|
|
57 |
|
|
|
0.2 |
% |
|
|
633 |
|
|
|
2.0 |
% |
|
Total net accounts receivable |
|
$ |
37,041 |
|
|
|
100.0 |
% |
|
$ |
31,444 |
|
|
|
100.0 |
% |
F-16
The following table sets forth the accounts receivable allowances as of December 31, 2018 and December 31, 2017:
|
|
|
As of |
|
|
As of |
|
||||||||||
|
(amounts in thousands) |
|
December 31, 2018 |
|
|
December 31, 2017 |
|
||||||||||
|
Allowances - accounts receivable |
|
$ |
|
|
% |
|
|
$ |
|
|
% |
|
||||
|
Doubtful accounts |
|
$ |
693 |
|
|
|
1.8 |
% |
|
$ |
1,415 |
|
|
|
4.1 |
% |
|
Rental revenue adjustments |
|
|
438 |
|
|
|
1.1 |
% |
|
|
947 |
|
|
|
2.7 |
% |
|
Sales returns |
|
|
890 |
|
|
|
2.3 |
% |
|
|
904 |
|
|
|
2.6 |
% |
|
Total allowances - accounts receivable |
|
$ |
2,021 |
|
|
|
5.2 |
% |
|
$ |
3,266 |
|
|
|
9.4 |
% |
Concentration of credit risk
Financial instruments that potentially subject the Company to concentration of credit risk consist principally of cash, cash equivalents, marketable securities and accounts receivable. At times, cash account balances may be in excess of the amounts insured by the Federal Deposit Insurance Corporation (FDIC). However, management believes the risk of loss to be minimal. The Company performs periodic evaluations of the relative credit standing of these institutions and has not experienced any losses on its cash and cash equivalents to date. The Company has also entered into hedging relationships with a single counterparty to offset the forecasted Euro-based revenues. The credit risk has been reduced due to a net settlement arrangement whereby the Company is allowed to net settle transactions with a single net amount payable by one party to the other.
Concentration of customers and vendors
The Company primarily sells its products to traditional home medical equipment providers, distributors, and resellers in the United States and in foreign countries on a credit basis. The Company also sells its products direct-to-consumers on a primarily prepayment basis. One single customer represented more than 10% of the Company’s total revenue for the years ended December 31, 2018, 2017, and 2016. Two customers represented more than 10% of the Company’s net accounts receivable balance with accounts receivable balances of $16,198 and $4,155, respectively, as of December 31, 2018, and $10,394 and $6,459, respectively, as of December 31, 2017.
The Company also rents products direct-to-consumers for insurance reimbursement, which resulted in a customer concentration relating to Medicare’s service reimbursement programs in 2016. Medicare’s service reimbursement programs accounted for 72.6% of rental revenue in the year ended December 31, 2016 and based on total revenue was 12.4% for the year ended December 31, 2016. Medicare did not represent more than 10% of the Company’s total revenue in the years ended December 31, 2018 and 2017. Medicare did not represent more than 10% of the Company’s net accounts receivable balance as of December 31, 2018 and 2017.
The Company currently purchases raw materials from a limited number of vendors, which resulted in a concentration of three major vendors. The three major vendors supply the Company with raw materials used to manufacture the Company’s products. For the year ended December 31, 2018, the Company’s three major vendors accounted for 20.0%, 11.9% and 10.2%, respectively, of total raw material purchases. For the year ended December 31, 2017, the Company’s three major vendors accounted for 19.7%, 15.4% and 9.5%, respectively, of total raw material purchases.
A portion of revenue is earned from sales outside the United States. Approximately 74.8% of the non-U.S. revenue for the year ended December 31, 2018 was invoiced in Euros. A breakdown of the Company’s revenue from U.S. and non-U.S. sources for the years ended December 31, 2018, 2017 and 2016 is as follows:
|
|
Years ended December 31, |
|
|||||||||
|
(amounts in thousands) |
2018 |
|
|
2017 |
|
|
2016 |
|
|||
|
U.S. revenue |
$ |
280,778 |
|
|
$ |
193,919 |
|
|
$ |
152,723 |
|
|
Non-U.S. revenue |
|
77,333 |
|
|
|
55,519 |
|
|
|
50,106 |
|
|
Total revenue |
$ |
358,111 |
|
|
$ |
249,438 |
|
|
$ |
202,829 |
|
F-17
Inventories are stated at the lower of cost or market and net realizable value. Cost is determined using a standard cost method, including material, labor and manufacturing overhead, whereby the standard costs are updated at least quarterly to reflect approximate actual costs using the first-in, first-out (FIFO) method. The Company records adjustments at least quarterly to inventory for potentially excess, obsolete, slow-moving or impaired items. The Company recorded noncurrent inventory related to inventories that are expected to be realized or consumed after one year of $1,085 and $644 as of December 31, 2018 and 2017, respectively. Noncurrent inventories are primarily related to raw materials purchased in bulk to support long-term expected repairs to reduce costs and are classified in other assets. During the years ended December 31, 2018, 2017 and 2016, $1,187, $1,055 and $1,454, respectively, of inventory was transferred to rental equipment and was considered a noncash transaction in the production and purchase of rental equipment on the consolidated statements of cash flows. Inventories that are considered current consist of the following:
|
|
December 31, |
|
|||||
|
(amounts in thousands) |
2018 |
|
|
2017 |
|
||
|
Raw materials and work-in-progress |
$ |
24,980 |
|
|
$ |
16,324 |
|
|
Finished goods |
|
2,756 |
|
|
|
2,917 |
|
|
Less: reserves |
|
(665 |
) |
|
|
(399 |
) |
|
Inventories |
$ |
27,071 |
|
|
$ |
18,842 |
|
Property and equipment
Property and equipment are stated at cost. Depreciation and amortization are calculated using the straight-line method over the assets’ estimated useful lives as follows:
|
Rental equipment |
1.5-5 years |
|
|
|
|
|
Manufacturing equipment and tooling |
3-5 years |
|
|
|
|
|
Computer equipment and software |
2-3 years |
|
|
|
|
|
Furniture and equipment |
3-5 years |
|
|
|
|
|
Leasehold improvements |
Lesser of estimated useful life or remaining lease term |
||||
Expenditures for additions, improvements and replacements are capitalized and depreciated to a salvage value of $0. Repair and maintenance costs on rental equipment are included in cost of rental revenue on the consolidated statements of comprehensive income. Repair and maintenance expense, which includes labor, parts and freight, for rental equipment was $2,289, $2,385 and $2,464 for the years ended December 31, 2018, 2017 and 2016, respectively.
Included within property and equipment is construction in process, primarily related to the design and engineering of tooling, jigs and other machinery. In addition, this item also includes computer software or development costs that have been purchased but have not completed the final configuration process for implementation into the Company’s systems. These items have not been placed in service; therefore, no depreciation or amortization was recognized for these items in the respective periods.
Depreciation and amortization expense related to rental equipment and other property and equipment are summarized below for the years ended December 31, 2018, 2017 and 2016, respectively.
|
|
Years ended December 31, |
|
|||||||||
|
(amounts in thousands) |
2018 |
|
|
2017 |
|
|
2016 |
|
|||
|
Rental equipment |
$ |
7,567 |
|
|
$ |
9,835 |
|
|
$ |
11,429 |
|
|
Other property and equipment |
|
2,463 |
|
|
|
1,960 |
|
|
|
2,028 |
|
|
Total depreciation and amortization |
$ |
10,030 |
|
|
$ |
11,795 |
|
|
$ |
13,457 |
|
F-18
Property and equipment and rental equipment with associated accumulated depreciation is summarized below as of December 31, 2018 and 2017, respectively.
|
(amounts in thousands) |
December 31, |
|
|||||
|
Property and equipment |
2018 |
|
|
2017 |
|
||
|
Rental equipment, net of allowances of $594 and $754, respectively |
$ |
43,038 |
|
|
$ |
49,349 |
|
|
Other property and equipment |
|
21,596 |
|
|
|
15,219 |
|
|
Property and equipment |
|
64,634 |
|
|
|
64,568 |
|
|
Accumulated depreciation |
|
|
|
|
|
|
|
|
Rental equipment |
|
31,813 |
|
|
|
34,754 |
|
|
Other property and equipment |
|
10,480 |
|
|
|
9,711 |
|
|
Accumulated depreciation |
|
42,293 |
|
|
|
44,465 |
|
|
Property and equipment, net |
|
|
|
|
|
|
|
|
Rental equipment, net of allowances of $594 and $754, respectively |
|
11,225 |
|
|
|
14,595 |
|
|
Other property and equipment |
|
11,116 |
|
|
|
5,508 |
|
|
Property and equipment, net |
$ |
22,341 |
|
|
$ |
20,103 |
|
Long-lived assets
The Company accounts for the impairment and disposition of long-lived assets in accordance with ASC 360—Property, Plant, and Equipment. In accordance with ASC 360, long-lived assets to be held are reviewed for events or changes in circumstances that indicate that their carrying value may not be recoverable. The Company periodically reviews the carrying value of long-lived assets to determine whether or not impairment to such value has occurred. No impairments were recorded as of December 31, 2018 and 2017.
Goodwill and intangible assets
Goodwill is tested for impairment on an annual basis as of October 1. Interim testing of goodwill for impairment is also required whenever an event occurs or circumstances change that would more likely than not reduce the fair value of a reporting unit or asset below its carrying amount. No impairments were recorded as of December 31, 2018 and 2017.
Finite-lived intangible assets are amortized over their useful lives and are tested for recoverability whenever events or changes in circumstances indicate that the carrying amount may not be recoverable. Customer relationships and non-compete agreements are amortized using the straight-line method.
Business combinations
The results of operations of the businesses acquired by the Company are included as of the acquisition date. The purchase price of an acquisition is allocated to the underlying assets acquired and liabilities assumed based upon their estimated fair values at the date of acquisition. To the extent the purchase price exceeds the fair value of the net identifiable tangible and intangible assets acquired and liabilities assumed, such excess is allocated to goodwill. The Company may adjust the preliminary purchase price allocation, as necessary, for up to one year after the acquisition closing date if it obtains more information regarding asset valuations and liabilities assumed. Acquisition-related expenses are recognized separately from the business combination and are expensed as incurred.
Loss contingencies
The Company is involved in various lawsuits, claims, investigations, and proceedings that arise in the ordinary course of business. The Company records a liability when it believes that it is both probable that a loss has been incurred and the amount can be reasonably estimated. Significant judgment is required to determine both probability and the estimated amount. The Company reviews at least quarterly and adjusts accordingly to reflect the impact of negotiations, settlements, rulings, advice of legal counsel, and updated information. At this time, the Company has no accrual related to lawsuits, claims, investigations and proceedings.
Deferred rent
The Company’s operating leases for its office facilities in California, Texas and Ohio include a rent abatement period and scheduled rent increases. The Company has accounted for the leases to provide straight-line charges to operations over the life of the leases.
F-19
Research and development costs are expensed as incurred.
Advertising costs
Advertising costs, which approximated $30,755, $12,511 and $6,215 during the years ended December 31, 2018, 2017 and 2016, respectively, are expensed as incurred, excluding the production costs of direct response advertising. Advertising costs are included in sales and marketing expense in the accompanying consolidated statements of comprehensive income.
Income taxes
The Company accounts for income taxes in accordance with ASC 740—Income Taxes. Under ASC 740, income taxes are recognized for the amount of taxes payable or refundable for the current period and deferred tax liabilities and assets are recognized for the future tax consequences of transactions that have been recognized in the Company’s consolidated financial statements or tax returns. A valuation allowance is provided when it is more likely than not that some portion, or all, of the deferred tax asset will not be realized.
The Company accounts for uncertainties in income tax in accordance with ASC 740-10—Accounting for Uncertainty in Income Taxes. ASC 740-10 prescribes a recognition threshold and measurement attribute for the financial statement recognition and measurement of a tax position taken or expected to be taken in a tax return. This accounting standard also provides guidance on derecognition, classification, interest and penalties, accounting in interim periods, disclosure and transition.
The Company recognizes interest and penalties on taxes, if any, within its income tax provision on its consolidated statements of comprehensive income. No interest or penalties were recognized during the periods presented.
On December 22, 2017, the Tax Cuts and Jobs Act (TCJA) was enacted into law, which significantly changes existing U.S. tax law and includes numerous provisions that affect the Company’s business. Changes include, but are not limited to, a corporate tax rate decrease from 34% to 21% effective for tax years beginning after December 31, 2017, expensing of capital expenditures, the transition of U.S. international taxation from a worldwide tax system to a territorial system, a one-time transition tax on the mandatory deemed repatriation of cumulative foreign earnings, and limitations on the deductibility of certain executive compensation and other deductions. The Company is required to recognize the effect of the tax law changes in the period of enactment, including the transition tax, re-measuring the Company’s U.S. deferred tax assets and liabilities, as well as reassessing the net realizability of the Company’s deferred tax assets and liabilities. During the fourth quarter of 2017, the Company recorded a provisional net charge of $7,578 related to the TCJA due to the remeasurement of its deferred tax assets. There was no impact related to the one-time transition tax on the mandatory deemed repatriation of foreign earnings. As of December 31, 2018, the Company completed its evaluation and analysis of the TCJA and there was no additional adjustment to the provisional amount recorded in the fourth quarter of 2017.
Accounting for stock-based compensation
The Company accounts for its stock-based compensation in accordance with ASC 718—Compensation—Stock Compensation, which establishes accounting for share-based awards, exchanged for employee services and requires companies to expense the estimated fair value of these awards over the requisite employee service period. Stock–based compensation cost for stock options and employee stock purchase plan are determined at the grant date using the Black-Scholes option pricing model. Stock-based compensation cost for stock incentive awards is based on the number of shares ultimately expected to vest, estimated at each reporting date based on management’s expectations regarding the relevant performance criteria. The value of the award that is ultimately expected to vest is recognized as expense on a straight-line basis over the employee’s requisite service period.
As part of the provisions of ASC 718, the Company is required to estimate potential forfeitures of stock grants and adjust compensation cost recorded accordingly. The estimate of forfeitures will be adjusted over the requisite service period to the extent that actual forfeitures differ, or are expected to differ, from such estimates. Changes in estimated forfeitures will be recognized through a cumulative catch-up adjustment in the period of change and will also impact the amount of stock compensation expense to be recognized in future periods.
F-20
The functional currency of the Company’s international subsidiaries is the local currency. The financial statements of the subsidiaries are translated to U.S. dollars using month-end exchange rates for assets and liabilities, and average rates of exchange for revenues, cost of revenue, operating expense and provision for income taxes. Translation gains and losses are recorded in accumulated other comprehensive income (loss) as a component of stockholders’ equity. Foreign exchange transaction gains and losses resulting from the conversion of the transaction currency to functional currency are reflected as a component of foreign currency exchange gains or losses in other income (expense) in the consolidated statements of comprehensive income.
Business segments
The Company operates and reports in only one operating and reportable segment – development, manufacturing, marketing, sales, and rental of respiratory products. Management reports financial information on a consolidated basis to the Company’s chief operating decision maker.
Earnings per share
Earnings per share (EPS) is computed in accordance with ASC 260—Earnings per Share and is calculated using the weighted-average number of common shares outstanding during each period. Diluted EPS assumes the conversion, exercise or issuance of all potential common stock equivalents (which can include dilution of outstanding stock options, restricted stock units and restricted stock awards) unless the effect is to reduce a loss or increase the income per share. For purposes of this calculation, common stock subject to repurchase by the Company, options, and other dilutive awards are considered to be common stock equivalents and are only included in the calculation of diluted earnings per share when their effect is dilutive.
Basic earnings per share is calculated using the Company’s weighted-average outstanding common shares. Diluted earnings per share is calculated using the Company’s weighted-average outstanding common shares including the dilutive effect of stock awards as determined under the treasury stock method.
The computation of EPS is as follows:
|
|
Years ended December 31, |
|
|||||||||
|
(amounts in thousands, except share and per share amounts) |
2018 |
|
|
2017 |
|
|
2016 |
|
|||
|
Numerator—basic and diluted: |
|
|
|
|
|
|
|
|
|
|
|
|
Net income |
$ |
51,845 |
|
|
$ |
21,002 |
|
|
$ |
20,519 |
|
|
|
|
|
|
|
|
|
|
|
|
|
|
|
Denominator: |
|
|
|
|
|
|
|
|
|
|
|
|
Weighted-average common shares - basic common stock (1) |
|
21,266,696 |
|
|
|
20,683,807 |
|
|
|
20,067,152 |
|
|
Weighted-average common shares - diluted common stock |
|
22,514,513 |
|
|
|
21,897,988 |
|
|
|
21,095,867 |
|
|
|
|
|
|
|
|
|
|
|
|
|
|
|
Net income per share - basic common stock |
$ |
2.44 |
|
|
$ |
1.02 |
|
|
$ |
1.02 |
|
|
Net income per share - diluted common stock |
$ |
2.30 |
|
|
$ |
0.96 |
|
|
$ |
0.97 |
|
|
|
|
|
|
|
|
|
|
|
|
|
|
|
Denominator calculation from basic to diluted: |
|
|
|
|
|
|
|
|
|
|
|
|
Weighted-average common shares - basic common stock (1) |
|
21,266,696 |
|
|
|
20,683,807 |
|
|
|
20,067,152 |
|
|
Stock options and other dilutive awards |
|
1,247,817 |
|
|
|
1,214,181 |
|
|
|
1,028,715 |
|
|
Weighted-average common shares - diluted common stock |
|
22,514,513 |
|
|
|
21,897,988 |
|
|
|
21,095,867 |
|
|
Shares excluded from diluted weighted-average shares: |
|
|
|
|
|
|
|
|
|
|
|
|
Stock options |
|
— |
|
|
|
37,249 |
|
|
|
841,760 |
|
|
Restricted stock units and restricted stock awards |
|
39,330 |
|
|
|
26,064 |
|
|
|
— |
|
|
Shares excluded from diluted weighted-average shares |
|
39,330 |
|
|
|
63,313 |
|
|
|
841,760 |
|
|
(1) |
Unvested restricted stock units and restricted stock awards are not included as shares outstanding in the calculation of basic earnings per share. Vested restricted stock units and restricted stock awards are included in basic earnings per share if all vesting and performance criteria have been met. Performance-based restricted stock units and restricted stock awards are included in the number of shares used to calculate diluted earnings per share as long as all applicable performance criteria are met, and their effect is dilutive. Restricted stock awards are eligible to receive all dividends declared on the Company’s common shares during the vesting period; however, such dividends are not paid until the restrictions lapse. |
F-21
The computations of diluted net income attributable to common stockholders excluded common stock options, restricted stock units, and restricted stock awards, which were anti-dilutive for the years ended December 31, 2018, 2017 and 2016.
Recently issued accounting pronouncements not yet adopted
In February 2016, the Financial Accounting Standards Board (FASB) issued Accounting Standards Update (ASU) No. 2016-02, Leases (Topic 842). The new guidance will require organizations that lease assets—referred to as “lessees”—to recognize on the balance sheet the assets and liabilities for the rights and obligations created by those leases with lease terms of more than twelve months. This will increase the reported assets and liabilities – in some cases very significantly. ASU No. 2016-02 will take effect for public companies for fiscal years, and interim periods within those fiscal years, beginning after December 15, 2018. Early adoption will be permitted for all entities. In January 2018, the FASB issued ASU No. 2018-01, Land Easement Practice Expedient for Transition to Topic 842, which is an amendment to ASU No. 2016-02 that offers a practical expedient for accounting for land easements. This practical expedient allows an entity the option of not evaluating existing land easements under ASC 842. New or modified land easements will still require evaluation under ASC 842 on a prospective basis beginning on the date of adoption. The Company adopted the standard using the modified retrospective transition method at the adoption date of January 1, 2019 that does not require restatement of its comparative periods presented. As permitted under the transition guidance, the Company will carry forward the assessment of whether the Company’s contracts contain or are leases, classification of the Company’s leases and remaining lease terms. The Company elected the practical expedients to not record leases with an initial term of 12 months on the consolidated balance sheet and to not separate lease and non-lease components for all of our leases as the non-lease components are not significant to the overall lease costs. The Company finalized its analysis and the adoption of this standard will impact its operating leases, as disclosed in Note 7 – Commitments and contingencies, which are primarily relating to property. The Company will recognize approximately $6,400 right-of-use assets and operating lease liabilities on the consolidated balance sheets upon adoption, which will increase the Company’s total assets and liabilities.
In June 2016, the FASB issued ASU No. 2016-13, Accounting for Credit Losses (Topic 326). The new standard requires the use of an “expected loss” model on certain types of financial instruments. The standard also amends the impairment model for available-for-sale debt securities and requires estimated credit losses to be recorded as allowances instead of reductions to amortized cost of the securities. The ASU is effective for fiscal years beginning after December 15, 2019, and interim periods within those years, with early adoption permitted. The Company is evaluating the new guidance but does not expect it to have a material impact on the Company’s consolidated financial statement presentation or results.
In January 2017, the FASB issued ASU No. 2017-04, Simplifying the Test for Goodwill Impairment. The new guidance eliminates step two of the goodwill impairment test. Under the new guidance, an entity should recognize an impairment charge for the amount by which a reporting unit’s carrying value exceeds its fair value. The ASU is effective for fiscal years beginning after December 15, 2019, with early adoption permitted. The Company is currently evaluating the effect of the new guidance but does not expect it to have a material impact on the Company’s consolidated financial statement presentation or results.
In August 2017, the FASB issued ASU No. 2017-12, Derivatives and Hedging, which changes both the designation and measurement guidance for qualifying hedging relationships and the presentation of hedge results, in order to better align an entity’s risk management activities and financial reporting for hedging relationships. The amendments expand and refine hedge accounting for both nonfinancial and financial risk components and align the recognition and presentation of the effects of the hedging instrument and the hedged item in the financial statements. ASU No. 2017-12 is effective for annual reporting periods beginning after December 15, 2018, including interim periods within those annual reporting periods, with early adoption permitted. The Company adopted this standard on January 1, 2019 and adoption of this standard will not have a material impact on the Company’s consolidated financial statement presentation or results.
In January 2018, the FASB issued ASU No. 2018-02, Reclassification of Certain Tax Effects from Accumulated Other Comprehensive Income. The new guidance permits entities the option to reclassify tax effects that are stranded in accumulated other comprehensive income as a result of the implementation of the Tax Cuts and Jobs Act to retained earnings. The Company adopted this standard on January 1, 2019 using the beginning of the period of adoption method and adoption of this standard will not have a material impact on the Company’s consolidated financial statement presentation or results.
In June 2018, the FASB issued ASU No. 2018-07, Compensation - Stock Compensation (Topic 718): Improvements to Nonemployee Share-Based Payment Accounting. The new guidance modifies the accounting for nonemployee share-based payments. The Company adopted this standard on January 1, 2019 and adoption of this standard will not have a material impact on the Company’s consolidated financial statement presentation or results.
F-22
In August 2018, the FASB issued ASU No. 2018-13, Fair Value Measurement (Topic 820): Disclosure Framework – Changes to the Disclosure Requirements for Fair Value Measurement. The new guidance modifies the disclosure requirements on fair value measurements. The ASU is effective for fiscal years beginning after December 15, 2019, with early adoption permitted. While the Company continues to evaluate the effect of adopting this guidance, the Company expects the fair value disclosures related to marketable securities, as disclosed in Note 2 – Fair value of financial instruments, will be subject to the new standard.
In November 2018, the FASB issued ASU No. 2018-19, Codification Improvements to Topic 326, Financial Instruments-Credit Losses, which is an amendment to ASU No. 2016-13 that clarifies the scope of the guidance. The amendment clarifies that receivables arising from operating leases are not within the scope of ASU No. 2016-13 and impairment of receivables arising from operating leases should be accounted for in accordance with ASU No. 2016-02. As a result, the bad debt expense account associated with the rental revenue allowance for doubtful account will be charged to rental revenue instead of general and administrative expense upon adoption. This change will result in decreased rental revenue and decreased operating expense. The Company adopted the standard using the modified retrospective transition method at the adoption date of January 1, 2019 that does not require restatement of its comparative periods presented. The Company does not expect the impact of this reclassification to have a material impact on the Company’s consolidated financial statement presentation or results.
Recently adopted accounting pronouncements
In May 2014, the FASB issued ASU No. 2014-09, Revenue from Contracts with Customers, which superseded nearly all existing revenue recognition guidance under U.S. GAAP. The core principle of ASU No. 2014-09 is to recognize revenues when promised goods or services are transferred to customers in an amount that reflects the consideration to which an entity expects to be entitled for those goods or services. ASU No. 2014-09 defines a five-step process to achieve this core principle and, in doing so, more judgment and estimates may be required within the revenue recognition process than are required under existing U.S. GAAP. In March 2016, the FASB issued ASU No. 2016-08, Revenue with Contracts with Customers: Principal versus Agent Considerations (Reporting Revenue Gross versus Net), which is an amendment to ASU No. 2014-09 that improved the operability and understandability of implementation guidance of principal versus agent considerations by clarifying the determination of principal versus agent. The Company completed its adoption plan including assessment of the Company’s revenue streams and analysis of all outstanding contracts by application of the five-step model to those contracts and revenue streams. The Company adopted the standard on January 1, 2018, using the modified retrospective method. The Company finalized its analysis and the adoption of this standard did not have a material impact on the consolidated financial statements and internal controls over financial reporting.
In January 2016, the FASB issued ASU No. 2016-01, Financial Instruments – Overall (Subtopic 825-10): Recognition and Measurement of Financial Assets and Financial Liabilities. The new guidance amends various aspects of the recognition, measurement, presentation, and disclosure of financial instruments and requires the Company to prospectively record changes in the fair value of the Company’s marketable securities in net income instead of in accumulated other comprehensive income. The Company adopted this standard during 2018. The adoption of this ASU did not have a material effect on the Company’s consolidated financial statement presentation or results.
In January 2017, the FASB issued ASU No. 2017-01, Clarifying the Definition of a Business. The new guidance revises the definition of a business and provides new guidance in evaluating when a set of transferred assets and activities is a business. The Company adopted this standard on January 1, 2018. The adoption of this ASU did not have a material effect on the Company’s consolidated financial statement presentation or results.
In August 2018, the FASB issued ASU No. 2018-15, Intangibles – Goodwill and Other – Internal-Use Software (Subtopic 350-40): Customer’s Accounting for Implementation Costs Incurred in a Cloud Computing Arrangement That Is a Service Contract. The new guidance clarifies the accounting for implementation costs in cloud computing arrangements. The ASU is effective for fiscal years beginning after December 15, 2019, with early adoption permitted. The Company adopted this standard on October 1, 2018 using the prospective method. Adoption of this standard did not have a material impact on the Company’s consolidated financial statement presentation or results.
F-23
3. Goodwill and other identifiable intangible assets
Goodwill
The changes in the carrying amount of goodwill for the years ended December 31, 2018 and 2017 were as follows:
|
(amounts in thousands) |
|
|
|
|
|
Balance as of December 31, 2016 |
|
$ |
— |
|
|
Acquisition |
|
|
2,154 |
|
|
Translation adjustment |
|
|
209 |
|
|
Balance as of December 31, 2017 |
|
$ |
2,363 |
|
|
Translation adjustment |
|
|
(106 |
) |
|
Balance as of December 31, 2018 |
|
$ |
2,257 |
|
Intangible assets
There were no impairments recorded related to the Company’s intangible assets as of December 31, 2018 and 2017. Amortization expense for intangible assets for the years ended December 31, 2018, 2017 and 2016 was $1,265, $507 and $101, respectively.
The following tables represent the changes in net carrying values of the intangibles as of the respective dates:
|
|
|
Average |
|
|
|
|
|
|
|
|
|
|
|
|
|
|
|
estimated |
|
Gross |
|
|
|
|
|
|
|
|
|
|
|
(amounts in thousands) |
|
useful lives |
|
carrying |
|
|
Accumulated |
|
|
|
|
|
||
|
December 31, 2018 |
|
(in years) |
|
amount |
|
|
amortization |
|
|
Net amount |
|
|||
|
Licenses |
|
10 |
|
$ |
185 |
|
|
$ |
155 |
|
|
$ |
30 |
|
|
Patents and websites |
|
5 |
|
|
4,164 |
|
|
|
1,640 |
|
|
|
2,524 |
|
|
Customer relationships |
|
4 |
|
|
1,373 |
|
|
|
572 |
|
|
|
801 |
|
|
Non-compete agreement |
|
2.3 |
|
|
229 |
|
|
|
154 |
|
|
|
75 |
|
|
Commercials |
|
2-3 |
|
|
633 |
|
|
|
308 |
|
|
|
325 |
|
|
Total |
|
|
|
$ |
6,584 |
|
|
$ |
2,829 |
|
|
$ |
3,755 |
|
|
|
|
|
|
|
|
|
|
|
|
|
|
|
|
|
|
|
|
|
|
|
|
|
|
|
|
|
|
|
|
|
|
|
|
Average |
|
|
|
|
|
|
|
|
|
|
|
|
|
|
|
estimated |
|
Gross |
|
|
|
|
|
|
|
|
|
|
|
(amounts in thousands) |
|
useful lives |
|
carrying |
|
|
Accumulated |
|
|
|
|
|
||
|
December 31, 2017 |
|
(in years) |
|
amount |
|
|
amortization |
|
|
Net amount |
|
|||
|
Licenses |
|
10 |
|
$ |
185 |
|
|
$ |
137 |
|
|
$ |
48 |
|
|
Patents and websites |
|
5 |
|
|
4,173 |
|
|
|
959 |
|
|
|
3,214 |
|
|
Customer relationships |
|
4 |
|
|
1,437 |
|
|
|
240 |
|
|
|
1,197 |
|
|
Non-compete agreement |
|
3 |
|
|
240 |
|
|
|
52 |
|
|
|
188 |
|
|
Commercials |
|
2-3 |
|
|
303 |
|
|
|
233 |
|
|
|
70 |
|
|
Total |
|
|
|
$ |
6,338 |
|
|
$ |
1,621 |
|
|
$ |
4,717 |
|
Annual estimated amortization expense for each of the succeeding fiscal years is as follows:
|
|
|
|
|
|
|
(amounts in thousands) |
|
Intangible |
|
|
|
Years ending December 31, |
|
amortization |
|
|
|
2019 |
|
$ |
1,234 |
|
|
2020 |
|
|
1,132 |
|
|
2021 |
|
|
844 |
|
|
2022 |
|
|
545 |
|
|
2023 |
|
|
— |
|
|
Thereafter |
|
|
— |
|
|
Total |
|
$ |
3,755 |
|
F-24
4. Current liabilities
Accounts payable and accrued expenses as of December 31, 2018 and 2017 consisted of the following:
|
|
|
December 31, |
|
|||||
|
(amounts in thousands) |
|
2018 |
|
|
2017 |
|
||
|
Accounts payable |
|
$ |
13,720 |
|
|
$ |
9,541 |
|
|
Accrued inventory (in-transit and unvouchered receipts) and trade payables |
|
|
9,597 |
|
|
|
7,252 |
|
|
Accrued purchasing card liability |
|
|
2,089 |
|
|
|
2,381 |
|
|
Accrued franchise, sales and use taxes |
|
|
518 |
|
|
|
479 |
|
|
Other accrued expenses |
|
|
862 |
|
|
|
973 |
|
|
Accounts payable and accrued expenses |
|
$ |
26,786 |
|
|
$ |
20,626 |
|
Accrued payroll as of December 31, 2018 and 2017 consisted of the following:
|
|
|
December 31, |
|
|||||
|
(amounts in thousands) |
|
2018 |
|
|
2017 |
|
||
|
Accrued bonuses |
|
$ |
4,780 |
|
|
$ |
3,086 |
|
|
Accrued wages and other payroll related items |
|
|
3,494 |
|
|
|
1,746 |
|
|
Accrued vacation |
|
|
1,959 |
|
|
|
1,338 |
|
|
Accrued employee stock purchase plan deductions |
|
|
1,174 |
|
|
|
707 |
|
|
Accrued payroll |
|
$ |
11,407 |
|
|
$ |
6,877 |
|
5. Income taxes
The components of the Company’s income before provision for income taxes are as follows:
|
|
|
Years ended December 31, |
|
|||||||||
|
(amounts in thousands) |
|
2018 |
|
|
2017 |
|
|
2016 |
|
|||
|
United States |
|
$ |
40,245 |
|
|
$ |
29,121 |
|
|
$ |
22,725 |
|
|
Foreign |
|
|
210 |
|
|
|
535 |
|
|
|
— |
|
|
Income before provision for income taxes |
|
$ |
40,455 |
|
|
$ |
29,656 |
|
|
$ |
22,725 |
|
The provision for income taxes consists of the following:
|
|
|
Years ended December 31, |
|
|||||||||
|
(amounts in thousands) |
|
2018 |
|
|
2017 |
|
|
2016 |
|
|||
|
Current tax expense (benefit) |
|
|
|
|
|
|
|
|
|
|
|
|
|
Federal |
|
$ |
— |
|
|
$ |
245 |
|
|
$ |
451 |
|
|
State |
|
|
(40 |
) |
|
|
240 |
|
|
|
776 |
|
|
Foreign |
|
|
171 |
|
|
|
206 |
|
|
|
— |
|
|
Total current tax expense |
|
|
131 |
|
|
|
691 |
|
|
|
1,227 |
|
|
Deferred tax expense (benefit) |
|
|
|
|
|
|
|
|
|
|
|
|
|
Federal |
|
|
(9,774 |
) |
|
|
8,709 |
|
|
|
1,357 |
|
|
State |
|
|
(1,630 |
) |
|
|
92 |
|
|
|
590 |
|
|
Foreign |
|
|
(117 |
) |
|
|
(71 |
) |
|
|
— |
|
|
Total deferred tax expense (benefit) |
|
|
(11,521 |
) |
|
|
8,730 |
|
|
|
1,947 |
|
|
Tax benefit for change in valuation allowance |
|
|
— |
|
|
|
(767 |
) |
|
|
(968 |
) |
|
Total deferred tax expense (benefit), net |
|
|
(11,521 |
) |
|
|
7,963 |
|
|
|
979 |
|
|
Income tax expense (benefit) |
|
$ |
(11,390 |
) |
|
$ |
8,654 |
|
|
$ |
2,206 |
|
F-25
The components of deferred tax assets and liabilities consist of the following:
|
|
|
As of December 31, |
|
|||||
|
(amounts in thousands) |
|
2018 |
|
|
2017 |
|
||
|
Deferred tax assets (liabilities) |
|
|
|
|
|
|
|
|
|
Accrued expenses |
|
$ |
8,033 |
|
|
$ |
5,669 |
|
|
Net operating loss and credit carryforward |
|
|
19,805 |
|
|
|
10,378 |
|
|
Allowance, reserves and other |
|
|
3,490 |
|
|
|
3,301 |
|
|
Stock-based compensation |
|
|
3,253 |
|
|
|
2,598 |
|
|
Deferred tax assets |
|
|
34,581 |
|
|
|
21,946 |
|
|
Property, plant, and equipment |
|
|
(4,683 |
) |
|
|
(3,658 |
) |
|
Total |
|
$ |
29,898 |
|
|
$ |
18,288 |
|
Reconciliation of the federal statutory income tax rate to the effective income tax rate for the last three years is as follows:
|
|
|
Years ended December 31, |
|
|||||||||
|
|
|
2018 |
|
|
2017 |
|
|
2016 |
|
|||
|
U.S. Statutory rate |
|
|
21.00 |
% |
|
|
34.00 |
% |
|
|
34.00 |
% |
|
State income taxes, net of federal benefit |
|
|
(3.73 |
) |
|
|
0.37 |
|
|
|
0.88 |
|
|
Stock-based compensation |
|
|
(45.01 |
) |
|
|
(30.40 |
) |
|
|
(23.74 |
) |
|
Change in valuation allowance |
|
|
— |
|
|
|
(2.59 |
) |
|
|
(4.26 |
) |
|
R&D credit, net of reserve |
|
|
(1.39 |
) |
|
|
(1.43 |
) |
|
|
(1.75 |
) |
|
Expiration of net operating losses |
|
|
— |
|
|
|
2.76 |
|
|
|
4.51 |
|
|
Effect of U.S tax law change |
|
|
— |
|
|
|
25.55 |
|
|
|
— |
|
|
Other |
|
|
0.98 |
|
|
|
0.92 |
|
|
|
0.07 |
|
|
Effective income tax rate |
|
(28.15)% |
|
|
|
29.18 |
% |
|
|
9.71 |
% |
|
On December 22, 2017, TCJA was enacted into law, which significantly changes existing U.S. tax law and includes numerous provisions that affect the Company’s business. Changes include, but are not limited to, a corporate tax rate decrease from 34% to 21% effective for tax years beginning after December 31, 2017, expensing of capital expenditures, the transition of U.S. international taxation from a worldwide tax system to a territorial system, a one-time transition tax on the mandatory deemed repatriation of cumulative foreign earnings, and limitations on the deductibility of certain executive compensation and other deductions. The Company is required to recognize the effect of the tax law changes in the period of enactment, including the transition tax, re-measuring the Company’s U.S. deferred tax assets and liabilities, as well as reassessing the net realizability of the Company’s deferred tax assets and liabilities. During the fourth quarter of 2017, the Company recorded a provisional net charge of $7,578 related to the TCJA due to the remeasurement of its deferred tax assets. The one-time transition tax on the mandatory deemed repatriation of foreign earnings did not have a material impact on the consolidated financial statements. As of December 31, 2018, the Company completed its evaluation and analysis of the TCJA and there was no additional adjustment to the provisional amount recorded in the fourth quarter of 2017.
The Company operates in several taxing jurisdictions, including U.S. federal, multiple U.S. states and the Netherlands. The statute of limitations has expired for all tax years prior to 2015 for federal and 2014 to 2015 for various state tax purposes. However, the net operating loss generated on the Company’s federal and state tax returns in prior years may be subject to adjustments by the federal and state tax authorities.
As of December 31, 2018, the Company had $67,088 and $27,661 of federal and state net operating loss carryforwards, respectively, that begin to expire in 2026 and 2028 for federal and state purposes, respectively, if not utilized. As of December 31, 2018, the Company had federal and California research and development credit carryforward of $2,743 and $2,800, respectively. The federal credit will begin to expire in 2022; the California credit has indefinite carryforward.
Utilization of the Company’s net operating loss and tax credit carryforwards may be subject to annual limitations arising from ownership change limitations provided by the Internal Revenue Code and similar state provisions. Such annual limitations could result in the expiration of the net operating loss and tax credit carryforwards before their utilization.
F-26
The Company assess the available positive and negative evidence to estimate whether sufficient future taxable income will be generated to permit the use of deferred tax assets. As of December 31, 2018, the Company determined that it is more likely than not that deferred tax assets are realizable due the increase in income before income tax expense (benefit). Accordingly, the Company did not record a valuation allowance as of December 31, 2018. As of December 31, 2017, the Company released $767 of valuation allowance that had been established against deferred tax assets for California net operating losses that expired in 2017. As a result, the Company did not record a valuation allowance as of December 31, 2017.
The Company recognizes interest accrued and penalties related to unrecognized tax benefits as income tax expense. No interest or penalties were recognized during the periods presented.
Included in the balance of unrecognized tax benefits as of December 31, 2018, 2017 and 2016, were $1,294, $1,062 and $934, respectively, of tax benefits that, if recognized, would affect the effective tax rate. The Company believes that there will be no significant increases or decreases to unrecognized tax benefits within the next 12 months.
A reconciliation of the beginning and ending amount of unrecognized tax benefit is as follows:
|
|
|
December 31, |
|
|||||||||
|
(amounts in thousands) |
|
2018 |
|
|
2017 |
|
|
2016 |
|
|||
|
Reconciliation of liability for unrecognized tax benefits |
|
|
|
|
|
|
|
|
|
|
|
|
|
Balance at beginning of period |
|
$ |
1,062 |
|
|
$ |
934 |
|
|
$ |
773 |
|
|
Additions based on tax positions related to current year |
|
|
232 |
|
|
|
128 |
|
|
|
161 |
|
|
Balance at end of period |
|
$ |
1,294 |
|
|
$ |
1,062 |
|
|
$ |
934 |
|
6. Stockholders’ equity
Common stock
Each share of common stock is entitled to one vote. The holders of common stock are also entitled to receive dividends whenever funds are legally available and when declared by the board of directors, subject to the prior rights of holders of other classes of stock outstanding.
Preferred stock
Pursuant to the amended and restated certificate of incorporation filed by the Company in connection with the completion of its initial public offering, the Company’s board of directors is authorized to issue up to 10,000,000 shares of preferred stock in one or more series and to fix the rights, preferences, privileges and restrictions thereof. These rights, preferences and privileges could include dividend rights, conversion rights, voting rights, redemption rights, liquidation preferences, sinking fund terms and the number of shares constituting any series or the designation of such series, any or all of which may be greater than the rights of common stock. The issuance of preferred stock could adversely affect the voting power of holders of common stock and the likelihood that such holders will receive dividend payments and payments upon liquidation. In addition, the issuance of preferred stock could have the effect of delaying, deferring or preventing change in the Company’s control or other corporate action. As of December 31, 2018 and 2017, no shares of preferred stock were issued or outstanding, and the board of directors has not authorized or designated any rights, preferences, privileges and restrictions for any class of preferred stock.
Dividends
There were no dividends declared during the years ended December 31, 2018, 2017 and 2016.
Stock incentive plans
The Company has a 2002 Stock Incentive Plan (2002 Plan) as amended, under which the Company granted options to purchase shares of its common stock. As of December 31, 2018, options to purchase 4,123 shares of common stock remained outstanding under the 2002 Plan. The 2002 Plan was terminated in March 2012 in connection with the adoption of the 2012 Plan, and, accordingly, no new options are available for issuance under this plan. The 2002 Plan continues to govern outstanding awards granted thereunder.
F-27
The Company has a 2012 Equity Incentive Plan (2012 Plan) under which the Company granted options to purchase shares of its common stock. As of December 31, 2018, options to purchase 168,016 shares of common stock remained outstanding under the 2012 Plan. The 2012 Plan was terminated in connection with the Company’s initial public offering in February 2014, and accordingly, no new options are available for issuance under this plan. The 2012 Plan continues to govern outstanding awards granted thereunder.
The Company has a 2014 Equity Incentive Plan (2014 Plan) that provides for the grant of incentive stock options, within the meaning of Section 422 of the Internal Revenue Code, to the Company’s employees and any parent and subsidiary corporation’s employees, and for the grant of nonstatutory stock options, restricted stock, restricted stock units, restricted stock awards, stock appreciation rights, performance units and performance shares to its employees, directors and consultants and its parent and subsidiary corporations’ employees and consultants.
As of December 31, 2018, awards with respect to 1,095,964 shares of the Company’s common stock were outstanding, and 1,910,864 shares of common stock remained available for issuance under the 2014 Plan. The shares available for issuance under the 2014 Plan will be increased by any shares returned to the 2002 Plan, 2012 Plan and the 2014 Plan as a result of expiration or termination of awards (provided that the maximum number of shares that may be added to the 2014 Plan pursuant to such previously granted awards under the 2002 Plan and 2012 Plan is 2,328,569 shares). The number of shares available for issuance under the 2014 Plan also is increased annually on the first day of each fiscal year by an amount equal to the least of:
|
|
• |
895,346 shares; |
|
|
• |
4% of the outstanding shares of common stock as of the last day of the Company’s immediately preceding fiscal year; or |
|
|
• |
such other amount as the Company’s board of directors may determine. |
For the year ended December 31, 2018, an additional 839,054 shares were added to the 2014 Plan share reserve pursuant to the provision described above.
Stock options
Options typically expire between seven and ten years from the date of grant and vest over one to four year terms. Options have been granted to employees, directors and consultants of the Company, as determined by the board of directors, at the deemed fair market value of the shares underlying the options at the date of grant.
F-28
The activity for stock options under the Company’s stock plans is as follows:
|
|
|
|
|
|
|
|
|
|
|
|
|
|
Remaining |
|
|
|
|
|
|
|
|
|
|
|
|
|
|
|
|
|
|
|
|
weighted- |
|
|
|
|
|
|
|
|
|
|
|
|
|
|
|
|
Weighted- |
|
|
average |
|
|
Per share |
|
|||
|
|
|
|
|
|
|
|
|
|
average |
|
|
contractual |
|
|
average |
|
|||
|
|
|
|
|
|
Price per |
|
|
exercise |
|
|
terms |
|
|
intrinsic |
|
||||
|
|
Options |
|
|
share |
|
|
price |
|
|
(in years) |
|
|
value |
|
|||||
|
Outstanding as of December 31, 2015 |
|
2,295,370 |
|
|
$0.60-$46.66 |
|
|
$ |
19.36 |
|
|
|
5.98 |
|
|
$ |
21.07 |
|
|
|
Granted |
|
683,998 |
|
|
44.19-58.95 |
|
|
|
44.70 |
|
|
|
|
|
|
|
|
|
|
|
Exercised |
|
(570,079 |
) |
|
0.60-46.66 |
|
|
|
12.32 |
|
|
|
|
|
|
|
|
|
|
|
Forfeited |
|
(53,247 |
) |
|
1.17-44.19 |
|
|
|
28.09 |
|
|
|
|
|
|
|
|
|
|
|
Expired |
|
(515 |
) |
|
|
8.70 |
|
|
|
8.70 |
|
|
|
|
|
|
|
|
|
|
Outstanding as of December 31, 2016 |
|
2,355,527 |
|
|
0.60-58.95 |
|
|
|
28.22 |
|
|
|
5.42 |
|
|
|
38.95 |
|
|
|
Vested and exercisable as of December 31, 2016 |
|
1,023,865 |
|
|
0.60-46.66 |
|
|
|
16.61 |
|
|
|
4.96 |
|
|
|
50.56 |
|
|
|
Vested and expected to vest as of December 31, 2016 |
|
2,259,811 |
|
|
0.60-46.66 |
|
|
|
27.95 |
|
|
|
5.40 |
|
|
|
39.22 |
|
|
|
Outstanding as of December 31, 2016 |
|
2,355,527 |
|
|
0.60-58.95 |
|
|
|
28.22 |
|
|
|
5.42 |
|
|
|
38.95 |
|
|
|
Granted |
|
64,498 |
|
|
|
83.30 |
|
|
|
83.30 |
|
|
|
|
|
|
|
|
|
|
Exercised |
|
(520,393 |
) |
|
0.60-58.95 |
|
|
|
24.16 |
|
|
|
|
|
|
|
|
|
|
|
Forfeited |
|
(63,173 |
) |
|
24.52-58.95 |
|
|
|
43.74 |
|
|
|
|
|
|
|
|
|
|
|
Expired |
|
(33 |
) |
|
|
8.70 |
|
|
|
8.70 |
|
|
|
|
|
|
|
|
|
|
Outstanding as of December 31, 2017 |
|
1,836,426 |
|
|
0.60-83.30 |
|
|
|
30.77 |
|
|
|
4.58 |
|
|
|
88.31 |
|
|
|
Vested and exercisable as of December 31, 2017 |
|
1,176,504 |
|
|
0.60-83.30 |
|
|
|
24.33 |
|
|
|
4.39 |
|
|
|
94.75 |
|
|
|
Vested and expected to vest as of December 31, 2017 |
|
1,792,871 |
|
|
0.60-83.30 |
|
|
|
30.50 |
|
|
|
4.58 |
|
|
|
88.58 |
|
|
|
Outstanding as of December 31, 2017 |
|
1,836,426 |
|
|
0.60-83.30 |
|
|
|
30.77 |
|
|
|
4.58 |
|
|
|
88.31 |
|
|
|
Granted |
|
— |
|
|
|
— |
|
|
|
— |
|
|
|
|
|
|
|
|
|
|
Exercised |
|
(708,319 |
) |
|
0.60-58.95 |
|
|
|
24.22 |
|
|
|
|
|
|
|
|
|
|
|
Forfeited |
|
(771 |
) |
|
24.52-44.19 |
|
|
|
28.24 |
|
|
|
|
|
|
|
|
|
|
|
Expired |
|
— |
|
|
|
— |
|
|
|
— |
|
|
|
|
|
|
|
|
|
|
Outstanding as of December 31, 2018 |
|
1,127,336 |
|
|
0.75-83.30 |
|
|
|
34.89 |
|
|
|
3.84 |
|
|
|
89.28 |
|
|
|
Vested and exercisable as of December 31, 2018 |
|
851,039 |
|
|
0.75-83.30 |
|
|
|
32.12 |
|
|
|
3.75 |
|
|
|
92.05 |
|
|
|
Vested and expected to vest as of December 31, 2018 |
|
1,109,280 |
|
|
$0.75-$83.30 |
|
|
$ |
34.75 |
|
|
|
3.84 |
|
|
$ |
89.42 |
|
|
The total intrinsic value of options exercised during the years ended December 31, 2018, 2017, and 2016 was $98,743, $33,931, and $22,228, respectively. The unrecognized compensation expense related to non-vested stock-based compensation granted under the Plans as of December 31, 2018 was $4,072.
Stock incentive awards
The Company grants restricted stock units (RSUs) and restricted stock awards (RSAs) under the 2014 Plan (Stock Awards). The Stock Awards vest either based solely on the satisfaction of time-based service conditions or on the satisfaction of time-based service conditions combined with performance criteria. Stock Awards are subject to forfeiture if the holder’s services to the Company terminate before vesting.
Stock Awards granted with only time-based service vesting conditions generally vest over a four-year service period, as defined in the terms of each award. Stock Awards that vest based on the satisfaction of time-based service conditions combined with performance criteria generally vest over a three-year service and performance period, based on performance criteria established at the time of the award. The portion of the Stock Award that is earned may equal or be less than the targeted number of shares subject to the Stock Award depending on whether the performance criteria are met.
F-29
Stock Awards activity for the years ended December 31, 2018 and December 31, 2017 are summarized below:
|
|
|
|
|
|
|
|
|
|
|
|
|
|
Weighted- |
|
|
|
|
|
|
|
|
|
|
|
|
|
|
|
|
average |
|
|
|
|
|
|
|
|
|
|
|
|
|
|
|
|
grant |
|
|
|
|
|
|
|
|
Performance |
|
|
|
|
|
|
date fair |
|
||
|
|
|
|
|
|
and |
|
|
|
|
|
|
value |
|
||
|
|
Time-based |
|
|
time-based |
|
|
Total |
|
|
per share |
|
||||
|
Unvested restricted stock units as of December 31, 2016 |
|
— |
|
|
|
— |
|
|
|
— |
|
|
$ |
— |
|
|
Granted |
|
42,028 |
|
|
|
13,109 |
|
|
|
55,137 |
|
|
|
90.05 |
|
|
Vested |
|
— |
|
|
|
— |
|
|
|
— |
|
|
|
— |
|
|
Forfeited/canceled |
|
— |
|
|
|
— |
|
|
|
— |
|
|
|
— |
|
|
Unvested restricted stock units as of December 31, 2017 (1) |
|
42,028 |
|
|
|
13,109 |
|
|
|
55,137 |
|
|
$ |
90.05 |
|
|
Unvested and expected to vest restricted stock units outstanding as of December 31, 2017 |
|
|
|
|
|
|
|
|
|
48,589 |
|
|
$ |
89.95 |
|
|
Unvested restricted stock units as of December 31, 2017 |
|
42,028 |
|
|
|
13,109 |
|
|
|
55,137 |
|
|
$ |
90.05 |
|
|
Granted |
|
31,877 |
|
|
|
— |
|
|
|
31,877 |
|
|
|
143.50 |
|
|
Vested |
|
(13,742 |
) |
|
|
(4,370 |
) |
|
|
(18,112 |
) |
|
|
89.35 |
|
|
Forfeited/canceled |
|
(1,574 |
) |
|
|
— |
|
|
|
(1,574 |
) |
|
|
106.55 |
|
|
Unvested restricted stock units as of December 31, 2018 (1) |
|
58,589 |
|
|
|
8,739 |
|
|
|
67,328 |
|
|
$ |
115.16 |
|
|
Unvested and expected to vest restricted stock units outstanding as of December 31, 2018 |
|
|
|
|
|
|
|
|
|
62,504 |
|
|
$ |
115.98 |
|
|
Unvested restricted stock awards outstanding as of December 31, 2016 |
|
— |
|
|
|
— |
|
|
|
— |
|
|
$ |
— |
|
|
Granted |
|
20,789 |
|
|
|
20,785 |
|
|
|
41,574 |
|
|
|
91.52 |
|
|
Vested |
|
— |
|
|
|
— |
|
|
|
— |
|
|
|
— |
|
|
Forfeited/canceled |
|
— |
|
|
|
— |
|
|
|
— |
|
|
|
— |
|
|
Unvested restricted stock awards outstanding as of December 31, 2017 (1) |
|
20,789 |
|
|
|
20,785 |
|
|
|
41,574 |
|
|
$ |
91.52 |
|
|
Unvested and expected to vest restricted stock awards outstanding as of December 31, 2017 |
|
|
|
|
|
|
|
|
|
34,051 |
|
|
$ |
91.52 |
|
|
Unvested restricted stock awards outstanding as of December 31, 2017 |
|
20,789 |
|
|
|
20,785 |
|
|
|
41,574 |
|
|
$ |
91.52 |
|
|
Granted |
|
22,645 |
|
|
|
33,964 |
|
|
|
56,609 |
|
|
|
130.89 |
|
|
Vested |
|
(6,497 |
) |
|
|
(6,928 |
) |
|
|
(13,425 |
) |
|
|
91.52 |
|
|
Forfeited/canceled |
|
— |
|
|
|
— |
|
|
|
— |
|
|
|
— |
|
|
Unvested restricted stock awards outstanding as of December 31, 2018 (1) |
|
36,937 |
|
|
|
47,821 |
|
|
|
84,758 |
|
|
$ |
115.80 |
|
|
Unvested and expected to vest restricted stock awards outstanding as of December 31, 2018 |
|
|
|
|
|
|
|
|
|
65,773 |
|
|
$ |
115.85 |
|
|
(1) |
Outstanding restricted stock units and restricted stock awards are based on the maximum payout of the targeted number of shares. |
As of December 31, 2018, the unrecognized compensation cost related to unvested employee restricted stock units and restricted stock awards was $10,091, excluding estimated forfeitures. This amount is expected to be recognized over a weighted-average period of 2.7 years.
Employee stock purchase plan
The Company’s 2014 Employee Stock Purchase Plan (ESPP) provides for the grant to all eligible employees an option to purchase stock under the ESPP, within the meaning Section 423 of the Internal Revenue Code. The ESPP permits participants to purchase common stock through payroll deductions of up to 15% of their eligible compensation, which includes a participant’s base straight time gross earnings, incentive compensation, bonuses, overtime and shift premium, but exclusive of payments for equity compensation and other similar compensation. A participant may purchase a maximum of 1,500 shares during a purchase period. Amounts deducted and accumulated by the participant are used to purchase shares of the Company’s common stock at the end of each six-month period. The purchase price of the shares will be 85% of the lower of the fair market value of the Company’s common stock on the first trading day of each offering period or on the exercise date. The offering periods are currently approximately six months in length beginning on the first business day on or after March 1 and September 1 of each year and ending on the first business day on or after September 1 and March 1 approximately six months later.
F-30
As of December 31, 2018, a total of 746,448 shares of common stock were available for sale pursuant to the ESPP.
The number of shares available for sale under the ESPP is increased annually on the first day of each fiscal year equal to the least of:
|
|
• |
179,069 shares; |
|
|
• |
1.5% of the outstanding shares of the Company’s common stock on the last day of the Company’s immediately preceding fiscal year; or |
|
|
• |
such other amount as may be determined by the administrator. |
For the year ended December 31, 2018, an additional 179,069 shares were added to the ESPP share reserve pursuant to the provision described above.
Stock-based compensation
Stock-based compensation expense recognized for the years ended December 31, 2018, 2017 and 2016 was as follows:
|
|
Years ended December 31, |
|
|||||||||
|
(amounts in thousands) |
2018 |
|
|
2017 |
|
|
2016 |
|
|||
|
Stock-based compensation expense by type of award: |
|
|
|
|
|
|
|
|
|
|
|
|
Stock option plan awards |
$ |
6,015 |
|
|
$ |
7,652 |
|
|
$ |
6,850 |
|
|
Restricted stock units and restricted stock awards |
|
5,890 |
|
|
|
1,447 |
|
|
|
— |
|
|
Employee stock purchase plan |
|
885 |
|
|
|
541 |
|
|
|
444 |
|
|
Total stock-based compensation expense |
$ |
12,790 |
|
|
$ |
9,640 |
|
|
$ |
7,294 |
|
Employee stock-based compensation expense was calculated based on awards of stock options, restricted stock units and restricted stock awards ultimately expected to vest based on the Company’s historical award cancellations. The employee stock-based compensation expense recognized for the years ended December 31, 2018, 2017 and 2016 has been reduced for estimated forfeitures of stock option plan awards at a rate of 7.3%, 7.3% and 6.9%, respectively. The employee stock-based compensation expense recognized for the years ended December 31, 2018 and 2017 was reduced for estimated forfeitures of restricted stock at a rate of 4.7% and 6.0%, respectively. There were no grants of restricted stock units and restricted stock awards for the year ended December 31, 2016. ASC 718 requires forfeitures to be estimated at the time of grant and revised, if necessary, in subsequent periods if actual forfeitures differ from those estimates.
For the years ended December 31, 2018, 2017 and 2016, stock-based compensation expense recognized under ASC 718, included in cost of revenues, sales and marketing expense, general and administrative expense, and research and development expense was as follows:
|
|
Years ended December 31, |
|
|||||||||
|
(amounts in thousands) |
2018 |
|
|
2017 |
|
|
2016 |
|
|||
|
Cost of revenue |
$ |
1,060 |
|
|
$ |
845 |
|
|
$ |
639 |
|
|
Research and development |
|
1,314 |
|
|
|
1,015 |
|
|
|
776 |
|
|
Sales and marketing |
|
2,355 |
|
|
|
1,558 |
|
|
|
1,142 |
|
|
General and administrative |
|
8,061 |
|
|
|
6,222 |
|
|
|
4,737 |
|
|
Total stock-based compensation expense |
$ |
12,790 |
|
|
$ |
9,640 |
|
|
$ |
7,294 |
|
Valuation assumptions
The employee stock-based compensation expense is recognized under ASC 718. Stock-based compensation cost for stock awards is based on the number of shares ultimately expected to vest, estimated at each reporting date based on management’s expectations regarding the relevant performance criteria. The value of the award that is ultimately expected to vest is recognized as expense on a straight-line basis over the employee’s requisite service period for stock awards with a time-based service condition and on a graded vesting basis over the employee’s requisite service period for stock awards with performance and time-based service conditions.
Stock-based compensation cost for stock options and employee stock purchase plan are determined at the grant date using the Black-Scholes option pricing model.
F-31
The following table displays the assumptions that have been applied to estimate the fair value of stock option awards on the date of grant using the Black-Scholes option pricing model. During 2018, the Company did not grant any stock option awards.
|
|
|
2017 |
|
2016 |
|
Expected term (years) |
|
3.54-4.00 |
|
3.54-5.48 |
|
Risk free interest rate |
|
1.65-1.73% |
|
1.00-1.40% |
|
Expected dividend yield |
|
None |
|
None |
|
Volatility |
|
41.61-42.15% |
|
43.95-45.93% |
Under these assumptions, the total weighted-average fair value of stock options granted during the years ended December 31, 2017 and 2016 was $8,929 and $6,408, respectively. The Company made no stock option grants during the year ended December 31, 2018.
The following table displays the assumptions that have been applied to estimate the fair value of the Company’s shares to be issued under the ESPP using the Black-Scholes option pricing model.
|
|
|
2018 |
|
|
2017 |
|
|
2016 |
|
|||
|
Expected term (years) |
|
|
0.50 |
|
|
|
0.50 |
|
|
|
0.50 |
|
|
Risk free interest rate |
|
1.63-2.46% |
|
|
1.15-1.63% |
|
|
1.15-1.32% |
|
|||
|
Expected dividend yield |
|
None |
|
|
None |
|
|
None |
|
|||
|
Volatility |
|
37.34-44.00% |
|
|
42.35-45.34% |
|
|
43.28-44.81% |
|
|||
401(k) retirement savings plan
The Company maintains a 401(k) retirement savings plan for the benefit of eligible employees. Under the terms of this plan, eligible employees are able to make contributions to the plan on a tax-deferred basis. The Company began matching employees’ contributions, effective January 1, 2017. The Company contributed $865, net of forfeitures, and $557, net of forfeitures to the 401(k) plan for the years ended December 31, 2018 and 2017, respectively. The Company made no contributions to the 401(k) plan for the years ended December 31, 2016.
7. Commitments and contingencies
Leases and non-cancelable contractual obligations
The Company leases its facilities and certain equipment under operating leases that expire through September 2024. At December 31, 2018, the minimum aggregate payments due under operating leases and specified non-cancelable contractual obligations, which consist of software license and maintenance agreements, are summarized as follows:
|
|
|
|
|
|
|
|
|
|
|
Non-cancelable |
|
|
|
|
|
|
|
|
|
Operating |
|
|
Related party |
|
|
contractual |
|
|
|
|
|
|||
|
(amounts in thousands) |
|
leases |
|
|
leases |
|
|
obligations |
|
|
Total |
|
||||
|
2019 |
|
$ |
2,450 |
|
|
$ |
31 |
|
|
$ |
578 |
|
|
$ |
3,059 |
|
|
2020 |
|
|
2,212 |
|
|
|
10 |
|
|
|
578 |
|
|
|
2,800 |
|
|
2021 |
|
|
1,593 |
|
|
|
— |
|
|
|
457 |
|
|
|
2,050 |
|
|
2022 |
|
|
1,273 |
|
|
|
— |
|
|
|
— |
|
|
|
1,273 |
|
|
2023 |
|
|
1,215 |
|
|
|
— |
|
|
|
— |
|
|
|
1,215 |
|
|
Thereafter |
|
|
917 |
|
|
|
— |
|
|
|
— |
|
|
|
917 |
|
|
Total |
|
$ |
9,660 |
|
|
$ |
41 |
|
|
$ |
1,613 |
|
|
$ |
11,314 |
|
As a result of the MedSupport acquisition, the Company leases a property owned by a related party. Rent expense for the property was $33 and $21 for the years ended December 31, 2018 and 2017, respectively.
Rent expense of $1,638, $1,148 and $1,028 for the years ended December 31, 2018, 2017 and 2016, respectively, was included in the accompanying consolidated statements of comprehensive income.
F-32
The Company had approximately $61,000 of outstanding purchase orders with its outside vendors and suppliers as of December 31, 2018.
Warranty obligation
The following table identifies the changes in the Company’s aggregate product warranty liabilities for the years ended December 31, 2018, 2017 and 2016:
|
|
|
December 31, |
|
|||||||||
|
(amounts in thousands) |
|
2018 |
|
|
2017 |
|
|
2016 |
|
|||
|
Product warranty liability at beginning of period |
|
$ |
6,171 |
|
|
$ |
3,480 |
|
|
$ |
1,973 |
|
|
Accruals for warranties issued |
|
|
7,693 |
|
|
|
5,275 |
|
|
|
3,123 |
|
|
Adjustments related to preexisting warranties (including changes in estimates) |
|
|
90 |
|
|
|
200 |
|
|
|
118 |
|
|
Settlements made (in cash or in kind) |
|
|
(4,424 |
) |
|
|
(2,784 |
) |
|
|
(1,734 |
) |
|
Product warranty liability at end of period |
|
$ |
9,530 |
|
|
$ |
6,171 |
|
|
$ |
3,480 |
|
Legislation and HIPAA
The healthcare industry is subject to numerous laws and regulations of federal, state and local governments. These laws and regulations include, but are not necessarily limited to, matters such as licensure, accreditation, government healthcare program participation requirements, reimbursement for patient services, and Medicare and Medicaid fraud and abuse. Government activity has continued with respect to investigations and allegations concerning possible violations of fraud and abuse statutes and regulations by healthcare providers. Violations of these laws and regulations could result in exclusion from government healthcare programs together with the imposition of significant fines and penalties, as well as significant repayments for patient services previously billed.
The Company believes that it is in compliance in all material respects with applicable fraud and abuse regulations and other applicable government laws and regulations. Compliance with such laws and regulations can be subject to future government review and interpretation as well as regulatory actions unknown or unasserted at this time.
The Health Insurance Portability and Accountability Act of 1996 (HIPAA) ensures health insurance portability, reduces healthcare fraud and abuse, guarantees security and privacy of health information, and enforces standards for health information. The Health Information Technology for Economic and Clinical Health Act (HITECH Act) imposes notification requirements of certain security breaches relating to protected health information. The Company believes that it complies in all material respects with the provisions of those regulations that are applicable to the Company’s business.
Legal proceedings
The Company is party to various legal proceedings arising in the normal course of business. The Company carries insurance, subject to specified deductibles under the policies, to protect against losses from certain types of legal claims. At this time, the Company does not anticipate that any of these other proceedings will have a material adverse effect on the Company’s business. Regardless of the outcome, litigation can have an adverse impact on the Company because of defense and settlement costs, diversion of management resources, and other factors.
8. Foreign currency exchange contracts and hedging
As of December 31, 2018 and December 31, 2017, the Company’s total non-designated and designated derivative contracts had notional amounts totaling approximately $2,336 and $21,374, respectively, and $2,350 and $13,818, respectively. These contracts were comprised of offsetting contracts with the same counterparty, each expires within one to twelve months. During the years ended December 31, 2018, 2017, and 2016, these contracts had, net of tax, an unrealized gain of $404, an unrealized loss of $121, and an unrealized gain of $47, respectively.
The nonperformance risk of the Company and the counterparty did not have a material impact on the fair value of the derivatives. During the years ended December 31, 2018, 2017 and 2016, there were no ineffective portions relating to these hedges and the hedges remained effective through their respective settlement dates. As of December 31, 2018, the Company had twenty-nine designated hedges and four non-designated hedges. As of December 31, 2017, the Company had eighteen designated hedges and three non-designated hedges.
F-33
9. Quarterly summary of information (unaudited)
The following table sets forth the Company’s unaudited quarterly statements of income data in dollars for each of the eight quarters in the period ended December 31, 2018. The Company has prepared the quarterly statements of income data on a basis consistent with the audited financial statements. In the opinion of management, the financial information reflects all adjustments, consisting only of normal recurring adjustments, which the Company considers necessary for a fair presentation of this data. The results of historical periods are not necessarily indicative of the results of operations for any future period.
|
(amounts in thousands, except share and per share amounts) |
|
|
|
|
|
|
|
|
|
|
|
|
|
|
|
|
|
Quarterly Results 2018 |
|
Q1 March |
|
|
Q2 June |
|
|
Q3 September |
|
|
Q4 December |
|
||||
|
Total revenue |
|
$ |
79,051 |
|
|
$ |
97,238 |
|
|
$ |
95,291 |
|
|
$ |
86,531 |
|
|
Gross profit |
|
|
37,727 |
|
|
|
48,470 |
|
|
|
48,813 |
|
|
|
43,570 |
|
|
Income before benefit for income taxes |
|
|
9,687 |
|
|
|
13,646 |
|
|
|
11,299 |
|
|
|
5,823 |
|
|
Benefit for income taxes |
|
|
(1,071 |
) |
|
|
(964 |
) |
|
|
(5,133 |
) |
|
|
(4,222 |
) |
|
Net income |
|
|
10,758 |
|
|
|
14,610 |
|
|
|
16,432 |
|
|
|
10,045 |
|
|
Net income per share attributable to common stockholders: |
|
|
|
|
|
|
|
|
|
|
|
|
|
|
|
|
|
Basic |
|
$ |
0.51 |
|
|
$ |
0.69 |
|
|
$ |
0.77 |
|
|
$ |
0.47 |
|
|
Diluted |
|
$ |
0.48 |
|
|
$ |
0.65 |
|
|
$ |
0.73 |
|
|
$ |
0.44 |
|
|
Weighted-average number of shares used in calculating net income per share attributable to common stockholders: |
|
|
|
|
|
|
|
|
|
|
|
|
|
|
|
|
|
Basic common shares |
|
|
21,026,154 |
|
|
|
21,172,170 |
|
|
|
21,324,256 |
|
|
|
21,544,202 |
|
|
Diluted common shares |
|
|
22,295,213 |
|
|
|
22,503,749 |
|
|
|
22,659,052 |
|
|
|
22,600,038 |
|
|
(amounts in thousands, except share and per share amounts) |
|
|
|
|
|
|
|
|
|
|
|
|
|
|
|
|
|
Quarterly Results 2017 |
|
Q1 March |
|
|
Q2 June |
|
|
Q3 September |
|
|
Q4 December |
|
||||
|
Total revenue |
|
$ |
52,500 |
|
|
$ |
64,121 |
|
|
$ |
69,030 |
|
|
$ |
63,787 |
|
|
Gross profit |
|
|
25,744 |
|
|
|
31,567 |
|
|
|
33,170 |
|
|
|
30,756 |
|
|
Income before provision (benefit) for income taxes |
|
|
5,879 |
|
|
|
9,166 |
|
|
|
8,817 |
|
|
|
5,794 |
|
|
Provision (benefit) for income taxes |
|
|
(53 |
) |
|
|
828 |
|
|
|
1,479 |
|
|
|
6,400 |
|
|
Net income (loss) |
|
|
5,932 |
|
|
|
8,338 |
|
|
|
7,338 |
|
|
|
(606 |
) |
|
Net income (loss) per share attributable to common stockholders: |
|
|
|
|
|
|
|
|
|
|
|
|
|
|
|
|
|
Basic |
|
$ |
0.29 |
|
|
$ |
0.40 |
|
|
$ |
0.35 |
|
|
$ |
(0.03 |
) |
|
Diluted |
|
$ |
0.27 |
|
|
$ |
0.38 |
|
|
$ |
0.33 |
|
|
$ |
(0.03 |
) |
|
Weighted-average number of shares used in calculating net income (loss) per share attributable to common stockholders: |
|
|
|
|
|
|
|
|
|
|
|
|
|
|
|
|
|
Basic common shares |
|
|
20,489,532 |
|
|
|
20,622,320 |
|
|
|
20,753,789 |
|
|
|
20,869,589 |
|
|
Diluted common shares |
|
|
21,579,721 |
|
|
|
21,848,359 |
|
|
|
21,998,660 |
|
|
|
22,167,358 |
|
Earnings per share is computed independently for each of the quarters presented. Therefore, the sum of the quarterly amounts will not necessarily equal the total for the year.
F-34
Schedule II: Valuation and Qualifying Accounts
|
|
|
Balance at |
|
|
|
|
|
|
|
|
|
|
|
|
|
|
|
|
|
|
|
|
|
Beginning |
|
|
|
|
|
|
|
|
|
|
|
|
|
|
Balance at |
|
||
|
(amounts in thousands) |
|
of Year |
|
|
Additions |
|
|
Deletions |
|
|
Adjustments |
|
|
End of Year |
|
|||||
|
Year ended December 31, 2018 |
|
|
|
|
|
|
|
|
|
|
|
|
|
|
|
|
|
|
|
|
|
Allowance for doubtful accounts (1) |
|
$ |
1,415 |
|
|
$ |
1,685 |
|
|
$ |
2,677 |
|
|
$ |
270 |
|
|
$ |
693 |
|
|
Allowance for sales returns (2) |
|
|
904 |
|
|
|
15,834 |
|
|
|
15,848 |
|
|
|
— |
|
|
|
890 |
|
|
Allowance for rental revenue adjustments (3) |
|
|
947 |
|
|
|
2,678 |
|
|
|
2,917 |
|
|
|
(270 |
) |
|
|
438 |
|
|
Allowance for rental asset loss (4) |
|
|
754 |
|
|
|
408 |
|
|
|
568 |
|
|
|
— |
|
|
|
594 |
|
|
Year ended December 31, 2017 |
|
|
|
|
|
|
|
|
|
|
|
|
|
|
|
|
|
|
|
|
|
Allowance for doubtful accounts (1) |
|
$ |
1,869 |
|
|
$ |
3,864 |
|
|
$ |
4,418 |
|
|
$ |
100 |
|
|
$ |
1,415 |
|
|
Allowance for sales returns (2) |
|
|
585 |
|
|
|
9,909 |
|
|
|
9,590 |
|
|
|
— |
|
|
|
904 |
|
|
Allowance for rental revenue adjustments (3) |
|
|
6,078 |
|
|
|
5,057 |
|
|
|
10,088 |
|
|
|
(100 |
) |
|
|
947 |
|
|
Allowance for rental asset loss (4) |
|
|
725 |
|
|
|
561 |
|
|
|
532 |
|
|
|
— |
|
|
|
754 |
|
|
Year ended December 31, 2016 |
|
|
|
|
|
|
|
|
|
|
|
|
|
|
|
|
|
|
|
|
|
Allowance for doubtful accounts (1) |
|
$ |
1,664 |
|
|
$ |
3,580 |
|
|
$ |
2,575 |
|
|
$ |
(800 |
) |
|
$ |
1,869 |
|
|
Allowance for sales returns (2) |
|
|
366 |
|
|
|
7,502 |
|
|
|
7,283 |
|
|
|
— |
|
|
|
585 |
|
|
Allowance for rental revenue adjustments (3) |
|
|
4,115 |
|
|
|
10,777 |
|
|
|
9,614 |
|
|
|
800 |
|
|
|
6,078 |
|
|
Allowance for rental asset loss (4) |
|
|
850 |
|
|
|
455 |
|
|
|
580 |
|
|
|
— |
|
|
|
725 |
|
|
(1) |
The additions to the allowance for doubtful accounts represent the estimates of bad debt expense based upon factors for which the company evaluates the collectability of accounts receivable, with actual recoveries netted into additions. Deductions are the actual write-offs of the receivables. |
|
(2) |
The additions to the allowance for sales returns represent estimates of returns based upon historical returns experience, primarily for the direct-to-consumer sales channel. Deductions are the actual returns of products. |
|
(3) |
The additions to the allowance for rental revenue adjustments represent estimates of revenue adjustments that will need to be recorded for billing adjustments on rental revenue, net of recoveries. Deductions are the actual adjustments and write-offs of the rental receivables for such revenue adjustments. |
|
(4) |
The allowance for rental asset loss is based on estimated losses of the Company’s rental assets that will potentially be lost, stolen or unrecoverable from the patient. Deductions are the actual write-offs of the rental assets. |
F-35
|
Exhibit |
|
Description |
|
Incorporated |
|
Incorporated |
|
Date |
|
10.17 |
|
|
|
S-1 |
|
10.20 |
|
11/27/13 |
|
10.18 |
|
|
|
S-1 |
|
10.21 |
|
11/27/13 |
|
10.19 |
|
|
|
S-1 |
|
10.22 |
|
11/27/13 |
|
10.20 |
|
Lease Agreement, dated December 4, 2014, between the Registrant and TCIT Dallas Industrial, Inc. |
|
10-K |
|
10.23 |
|
04/27/15 |
|
10.21 |
|
|
|
10-Q |
|
10.1 |
|
05/12/15 |
|
10.22+ |
|
|
|
10-K |
|
10.28 |
|
02/28/17 |
|
10.23 |
|
|
|
8-K |
|
10.1 |
|
11/10/15 |
|
|
|
|
|
|
|
|
|
|
|
10.24* |
|
|
10-Q |
|
10.1
|
|
11/03/16 |
|
|
10.25* |
|
|
|
10-Q |
|
10.1 |
|
05/09/17 |
|
10.26* |
|
|
|
10-Q |
|
10.1 |
|
04/30/18 |
|
10.27 |
|
|
|
10-Q |
|
10.1 |
|
08/07/18 |
|
10.28 |
|
|
|
10-Q |
|
10.2 |
|
08/07/18 |
|
10.29 |
|
|
|
10-Q |
|
10.3 |
|
08/07/18 |
|
10.30+ |
|
|
|
8-K |
|
10.1 |
|
09/17/18 |
|
10.31+ |
|
Employment and Severance Agreement, dated August 17, 2018, between the Registrant and Bart Sanford. |
|
10-Q |
|
10.2 |
|
11/06/18 |
|
23.1 |
|
Consent of Deloitte & Touche LLP, Independent Registered Public Accounting Firm. |
|
Filed Herewith |
|
|
|
|
|
24.1 |
|
Powers of Attorney (contained in the signature page to this Annual Report on Form 10-K). |
|
Filed Herewith |
|
|
|
|
|
31.1 |
|
|
|
Filed Herewith |
|
|
|
|
|
31.2 |
|
|
|
Filed Herewith |
|
|
|
|
|
Exhibit |
|
Description |
|
Incorporated |
|
Incorporated |
|
Date |
|
32.1~ |
|
|
|
|
|
|
|
|
|
101.INS |
|
XBRL Instance Document |
|
|
|
|
|
|
|
101.SCH |
|
XBRL Taxonomy Extension Schema Document |
|
|
|
|
|
|
|
101.CAL |
|
XBRL Taxonomy Extension Calculation Linkbase Document |
|
|
|
|
|
|
|
101.LAB |
|
XBRL Taxonomy Extension Label Linkbase Document |
|
|
|
|
|
|
|
101.PRE |
|
XBRL Taxonomy Extension Presentation Linkbase Document |
|
|
|
|
|
|
|
101.DEF |
|
XBRL Taxonomy Extension Definition Document |
|
|
|
|
|
|
|
+ |
Indicates a management contract or compensatory plan. |
|
* |
Portions of the exhibit have been omitted pursuant to an order granted by the Securities and Exchange Commission for confidential treatment. |
|
~ |
The certifications attached as Exhibit 32.1 that accompany this Annual Report on Form 10-K, are deemed furnished and not filed with the Securities and Exchange Commission and are not to be incorporated by reference into any filing of Inogen, Inc. under the Securities Act of 1933, as amended, or the Securities Exchange Act of 1934, as amended, whether made before or after the date of this Annual Report on Form 10-K, irrespective of any general incorporation language contained in such filing. |
Pursuant to the requirements of Section 13 or 15(d) of the Securities Exchange Act of 1934, the registrant has duly caused this report to be signed on its behalf by the undersigned, thereunto duly authorized.
|
INOGEN, INC. |
||
|
(Registrant) |
||
|
|
|
|
|
By: |
|
/s/ Scott Wilkinson |
|
|
|
Scott Wilkinson |
|
|
|
Chief Executive Officer |
|
|
|
President Director |
|
|
|
(Principal Executive Officer) |
Dated: February 26, 2019
KNOW ALL PERSONS BY THESE PRESENTS, that each person whose signature appears below constitutes and appoints Scott Wilkinson and Alison Bauerlein, and each of them, as his or her true and lawful attorney-in-fact and agent, with full power of substitution and resubstitution, for him or her and in his or her name, place and stead, in any and all capacities, to sign any and all amendments to this Annual Report on Form 10-K, and to file the same, with all exhibits thereto, and other documents in connection therewith, with the Securities and Exchange Commission, granting unto said attorneys-in-fact and agents, and each of them, full power and authority to do and perform each and every act and thing requisite and necessary to be done in connection therewith, as fully to all intents and purposes as he or she might or could do in person, hereby ratifying and confirming all that said attorneys-in-fact and agents, or any of them, or their or his or her substitutes, may lawfully do or cause to be done by virtue thereof.
Pursuant to the requirements of the Securities Exchange Act of 1934, this report has been signed below by the following persons on behalf of the registrant and in the capacities and on the dates indicated.
|
Signature |
|
Title |
|
Date |
|
|
|
|
|
|
|
/s/ Scott Wilkinson |
|
Chief Executive Officer, President and Director |
|
February 26, 2019 |
|
Scott Wilkinson |
|
(Principal Executive Officer) |
|
|
|
|
|
|
|
|
|
/s/ Alison Bauerlein |
|
Chief Financial Officer |
|
February 26, 2019 |
|
Alison Bauerlein |
|
(Principal Accounting and Financial Officer) |
|
|
|
|
|
|
|
|
|
/s/ Heath Lukatch, Ph.D. |
|
Chairman of the Board |
|
February 26, 2019 |
|
Heath Lukatch, Ph.D. |
|
|
|
|
|
|
|
|
|
|
|
/s/ Benjamin Anderson-Ray |
|
Director |
|
February 26, 2019 |
|
Benjamin Anderson-Ray |
|
|
|
|
|
|
|
|
|
|
|
/s/ Heather Rider |
|
Director |
|
February 26, 2019 |
|
Heather Rider |
|
|
|
|
|
|
|
|
|
|
|
/s/ Loren McFarland |
|
Director |
|
February 26, 2019 |
|
Loren McFarland |
|
|
|
|
|
|
|
|
|
|
|
/s/ R. Scott Greer |
|
Director |
|
February 26, 2019 |
|
R. Scott Greer |
|
|
|
|
|
|
|
|
|
|
|
/s/ Scott Beardsley |
|
Director |
|
February 26, 2019 |
|
Scott Beardsley |
|
|
|
|
|
|
|
|
|
|
|
/s/ Raymond Huggenberger |
|
Director |
|
February 26, 2019 |
|
Raymond Huggenberger |
|
|
|
|